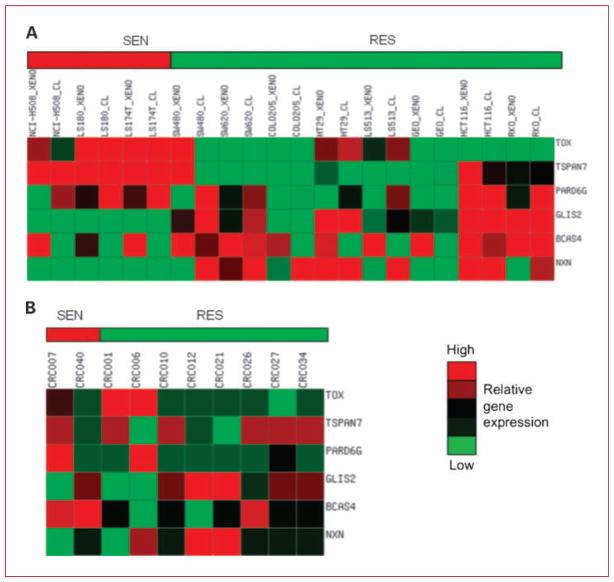
Fig. 3.
Heat map of the K-TSP gene pairs for predicting saracatinib sensitivity. A, relative gene expression profiles in the training set of the three gene pairs in (three sensitive and eight resistant) CRC cell lines in vitro and in vivo. The three gene pairs that predict sensitivity to saracatinib include TOX > GLIS2, TSPAN7 > BCAS4, and PARD6G > NXN. High (red) and low (green) gene expression. B, heat map of expression in the validation set of the three gene pairs. CRC006 and CRC007 were predicted to be sensitive.

