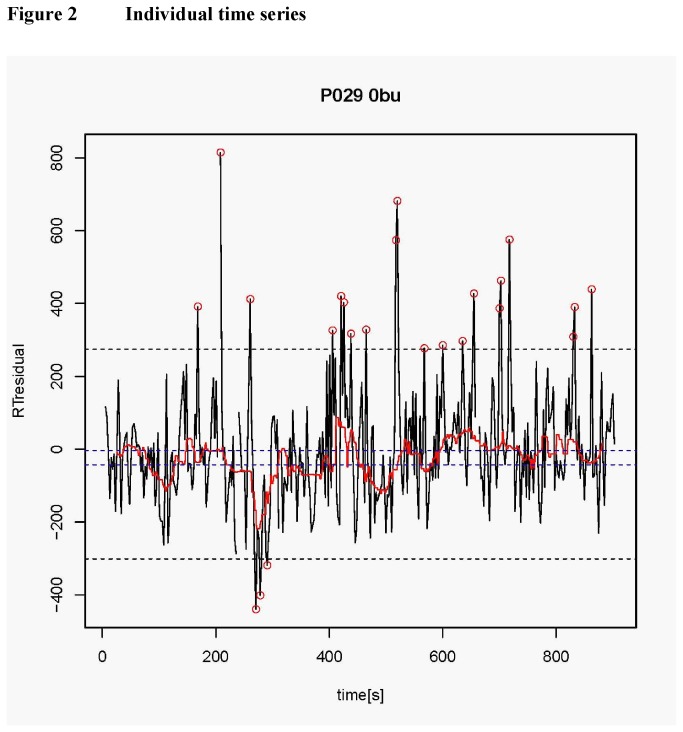
Figure 2. Typical residualized RT time series is shown for one patient (P029) and one condition (0-back non-jittered) for illustrative purposes.
Successive RTs are connected with black lines; the outer horizontal dashed lines mark the threshold for particularly low and high RTs (Gaussian 1% threshold, cf. Methods). Very fast or slow reactions, exceeding the thresholds, are marked with circles. The red line shows the 40 s running median of values within the thresholds (background response fluctuation) and the inner horizontal dashed lines its tercile boundaries (1/3 of all values lying in each partition). The occurrence of each of these events (low/high value or omission) was associated with the tercile of the background response fluctuation. It can be seen that the few very fast RTs occur during a time of fast background RTs; similarly the larger number of very slow RTs (contributing to τ) occur preferentially during phases of slow background RT fluctuation.

