
Figure 3. Number of infections averted per 100,000 person-years and cumulative number of life-years saved per ART treatment year for universal testing and immediate ART for all HIV-infected patients (UTT) in South Africa over the period 2010–2050.
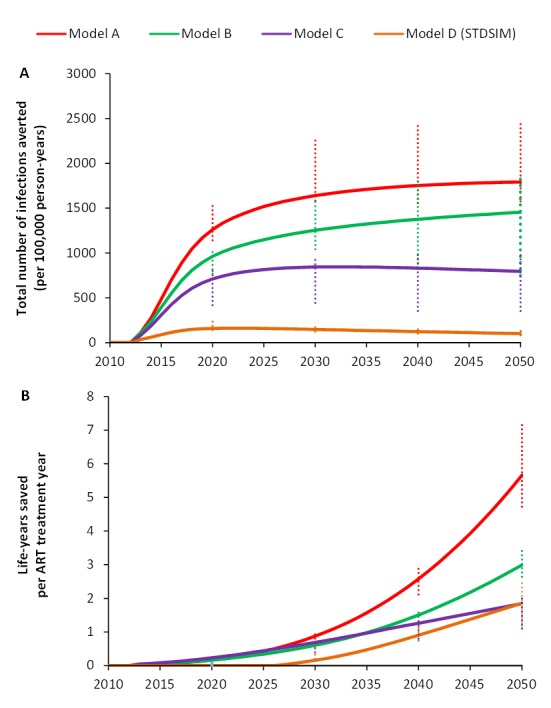
The intervention consists of annual screening of the adult population (aged 15+ y), and immediate ART for all HIV-infected patients. Intervention is scaled up linearly starting in 2012 and reaching 90% coverage in 2019. (A) Difference between cumulative numbers of new infections per 100,000 person-years in the UTT intervention scenario versus the baseline (for models A, B, and C, the baseline is no ART; for model D, the baseline is ART at CD4 count ≤350 cells/µl). (B) Cumulative number of life-years saved per person-year on ART treatment in the UTT intervention compared to the baseline (for models A, B, and C, the baseline is no ART; for model D, the baseline is ART at CD4 count ≤350 cells/µl). Error bars reflect ranges due to the uncertainty in the parameter values that were quantified based on fitting the model to the data.