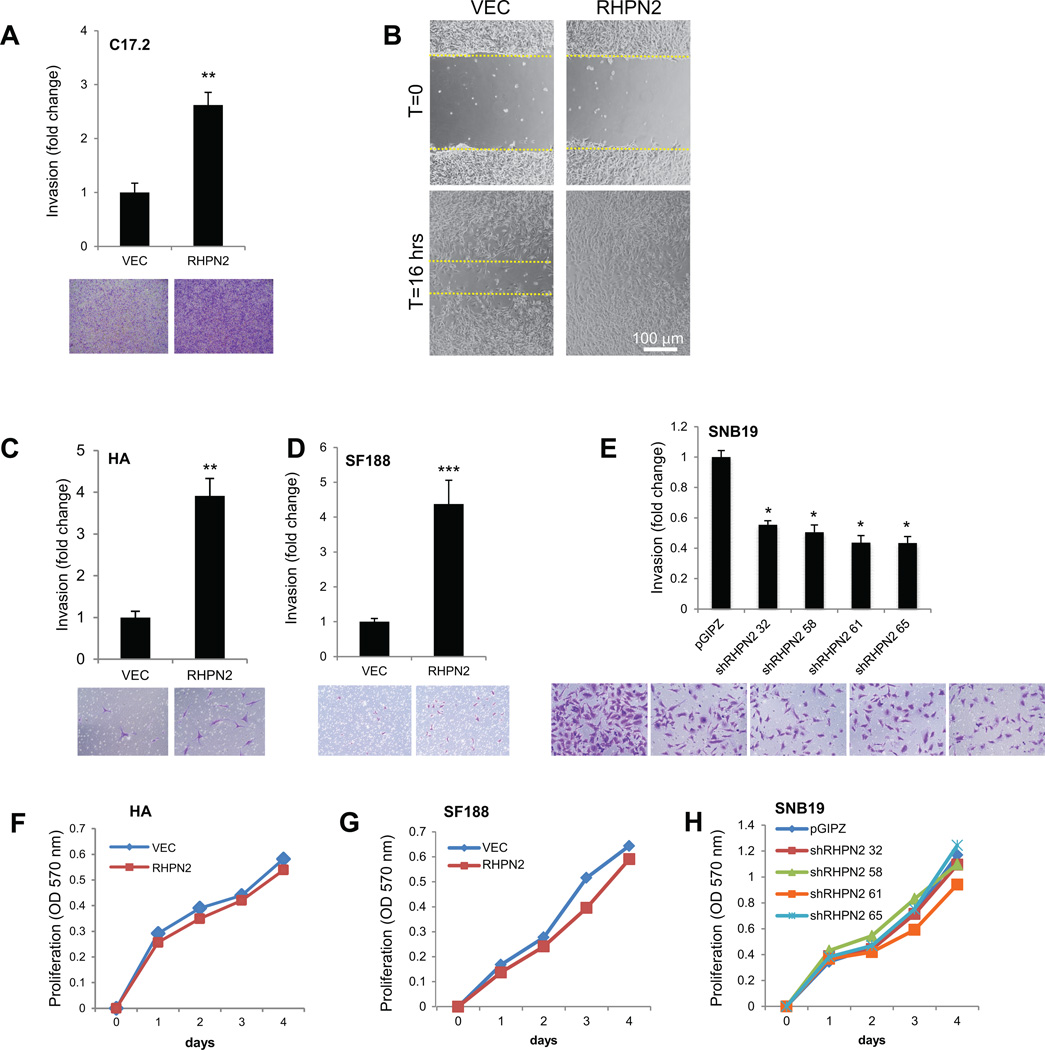
Figure 5. RHPN2 promotes cell invasion.
(A) Quantification of C17.2 invading cells. **p-value < 1×10⁻³.
(B) Microphotographs of C17.2 wound healing assay. Scale bar: 100 µm.
(C, D) Quantification of primary Human Astrocytes (HA) and SF188 invading cells at 24 hrs. **p-value < 1×10⁻³; ***p-value < 1×10⁻⁵.
(E) Quantification of SNB19 invading cells at 24 hrs, upon RHPN2 silencing. *p-value < 0.005.
(F–H) Proliferation of HA, SF188 and SNB19 cells, upon overexpression or silencing of RHPN2.
All graphs in this figure show mean values and standard deviation of three repeats.

