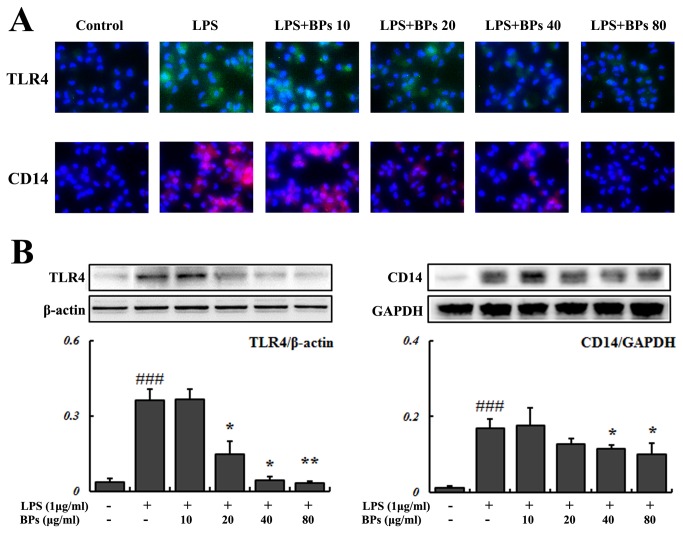
Figure 1. Effects of BPs on LPS-induced TLR4 and CD14 expression.
Macrophages were treated with medium only, LPS (1 μg/ml), or LPS in the presence of increasing concentrations of BPs (10-80 μg/ml). (A) Immunocytochemistry of TLR4 (green color) and CD14 (red color) in macrophages treated for 3 h. (B) Western blot quantification of TLR4 and CD14 after 24 h of treatment. β-actin and GAPDH are loading controls. Data are presented as mean ± SD and are representative of three independent experiments. ### P<0.001 compared with control group; * P<0.05, ** P<0.01 compared with LPS group.

