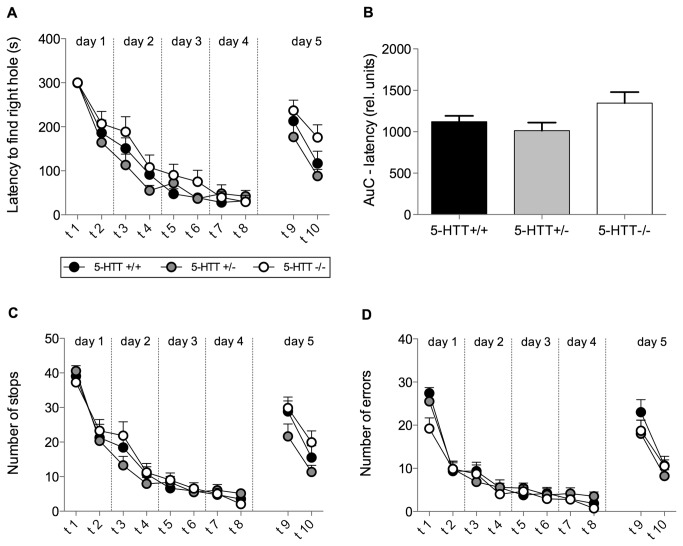
Figure 1. Learning performance in the Barnes maze task.
Mice of all three genotypes (5-HTT+/+, 5-HTT+/-, 5-HTT-/-) were tested twice per day on 4 consecutive days (acquisition phase; trials 1 - 8). Trials on day five represent reversal trials (trials 9 - 10). (A) Learning curve for the latency to enter the right hole. RM-ANOVA revealed a significant effect of trial (indicating learning performance) but no genotype effect. (B) The area under the learning curve (AuC) was calculated for each individual for statistical comparison of learning in the acquisition phase. ANOVA revealed no significant effects of genotype. (C) Curve depicting the number of stops during each trial. (D) Learning curve of the number of errors. For stops (C) and errors (D) RM-ANOVA revealed a significant effect of trial indicating learning performance but no genotype effect. Data in all figures represent means + SEM.

