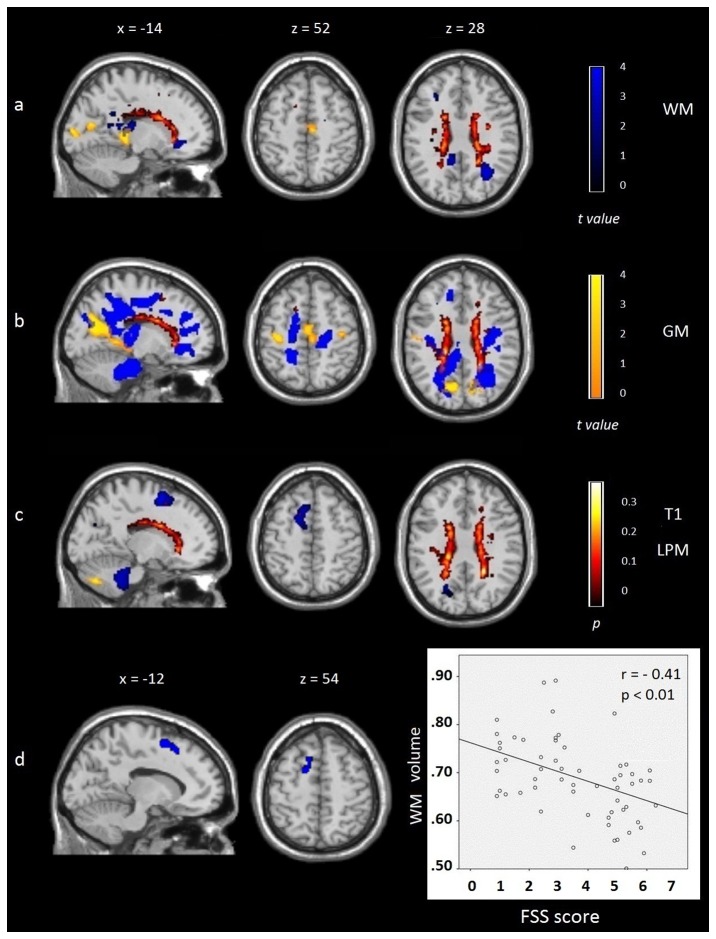
Figure 1. Overlay map of gray matter (GM; t values in yellow) and white matter (WM; t values in blue) atrophy distribution and lesion probability maps (t values in red) presented using family-wise error corrected for multiple comparisons.
(Monte Carlo p < .001).
A) Nonfatigued patients compared to healthy controls. B) Fatigued patients compared to healthy controls. C) Fatigued patients compared to nonfatigued patients. D) Correlation between high Fatigue Severity Scale (FSS) scores and reduction of WM volume in the left supplementary motor area in all MS patients. Images are presented in neurological convention. See text for further details.

