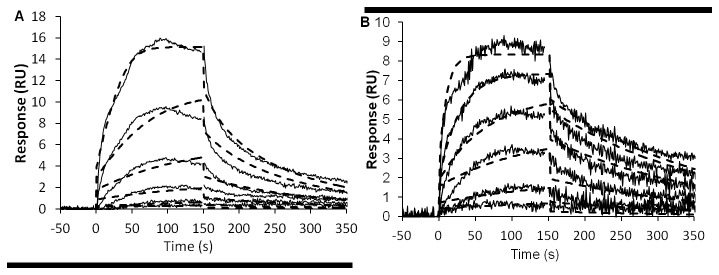
Figure 2. Kinetic analyses of BMP-2 binding to (A) dermatan sulfate (DS) and (B) heparin (HP).

Solid lines represent the binding curves for six BMP-2 concentrations ranging from 0.2 to 50 nM. The dotted lines depict the result of a global fit of a 1:1 interaction model to the binding data. The binding affinity, Kd, was calculated as the ratio of the dissociation and association rate constants, kd/ka. The study yielded an affinity constant, Kd, of 2.0±0.8 x 10⁻⁸ M for the binding of BMP-2 to DS and a Kd of 2.4±0.3 x10⁻⁹ M for the binding to HP. The standard deviation is based on the variation between duplicate experiments.
