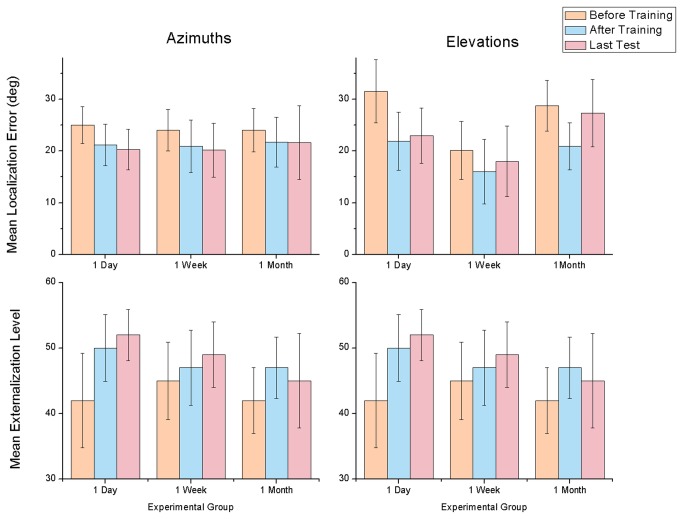
Figure 8. Results of the control condition.
Top graphics show localization error and bottom graphics display externalization levels. Left shows azimuth results and right shows elevation results. Results are organized according to the three experimental groups: one-day group was only retested one day after training; one-week group was retested only one week after; one-month was retested one month later. Bars represent results before training, after training, and in the last post-test (a day, week or month later). Error bars represent ±1 SD.

