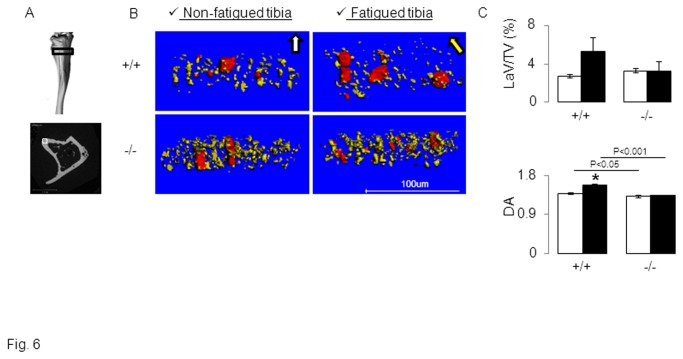
Figure 6. Effects of fatigue loading on the orientation of osteocyte lacunae in Postn -/- vs Postn +/+ mice.
3D reconstructions of osteocytic lacunae were obtained by high resolution-computed tomography scans. (A) Upper panel: The black box illustrates the region of interest, 30 slices from 1.8mm under the proximal growth plate, in which a small cortical region located in the postero-lateral surface of the tibia (Lower panel, white box) was eventually selected for 3D reconstructions. (B) 3 D reconstructions of the canal network (red tubes corresponding to blood vessels or real pores) and osteocyte lacunae (yellow ellipsoids) show the alignment of osteocyte lacunae parallel to the principal direction of mechanical loading in tibia of Postn +/+mice. In contrast, Postn -/- do not present oriented osteocyte lacunae either in the non-fatigued or fatigued tibia. (C) Lacunae volume on tissue volume (LaV/TV) and Degree of anisotropy (DA). * p<0.05 vs non-fatigued tibia. Bars show mean (± sem), black bars: fatigued tibia, white bars: non-fatigued tibia.

