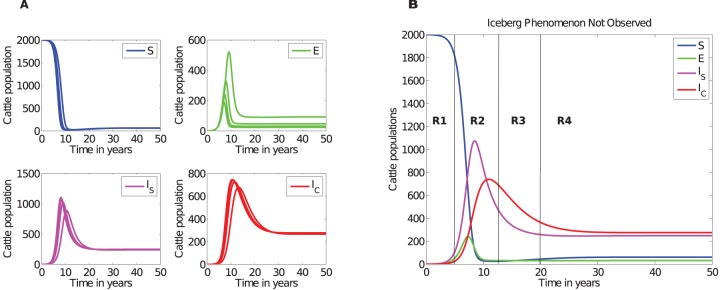
Figure 2. Simulated JD dynamics.

A), An illustration of MAP transmission in a farm when incubation,  , for the silent stage is varied from 4 months to 12 months in steps of 2 months. Qualitatively similar simulations are achieved with different combinations of parameters as long as
  . At any given time
  . B) Comparative analysis of cattle population at different disease stages in different time regions (see
Table 3 for ratios in different regions). Simulations were carried out using parameters given in Table 2 with
  (cattle natural death rate).
