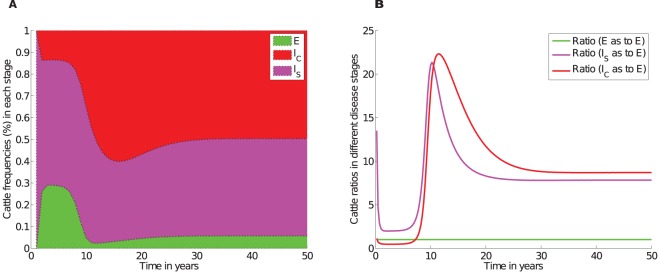
Figure 3. Percentages and ratios of animals in each sub-class.

A) Frequency (or percentage) compositions of cattle within the exposed, subclinical, and clinical classes over the course of the disease. B) Simulated exposed, subclinical and clinical cattle ratios over the course of the disease. Ratios in each category were calculated relative to cattle in the exposed class. Parameters used are given in Table 2.
