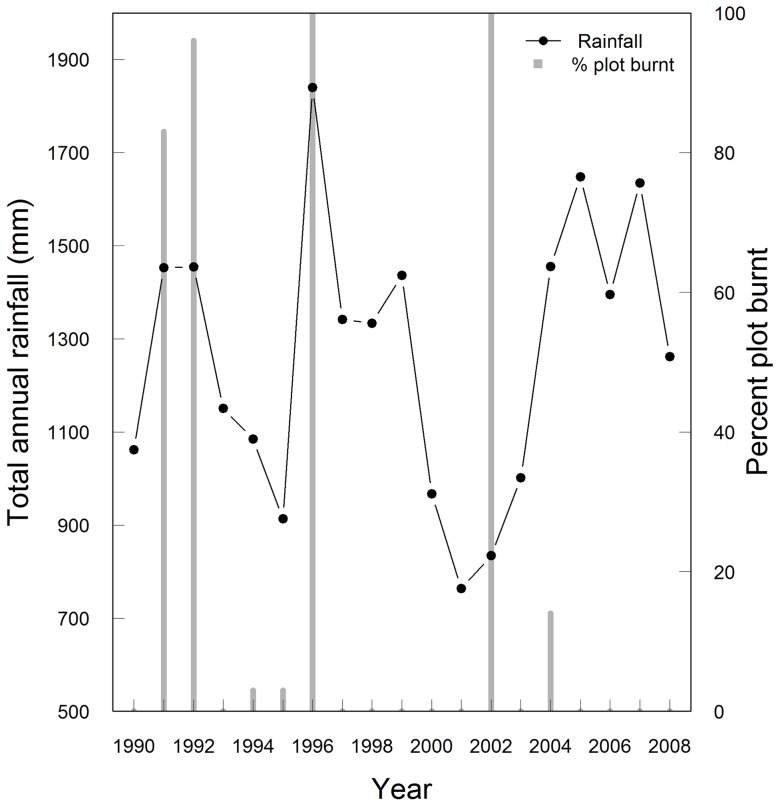
Figure 1. Interannual variability in rainfall and fire at the Mudumalai Forest Dynamics Plot.
The solid line and dots represent total annual rainfall (mm) while the grey bars represent the percentage of 10 m×10 m plots burnt each year. It must be noted that fires usually occur during the dry season of each year and are not related to the total rainfall in that year.

