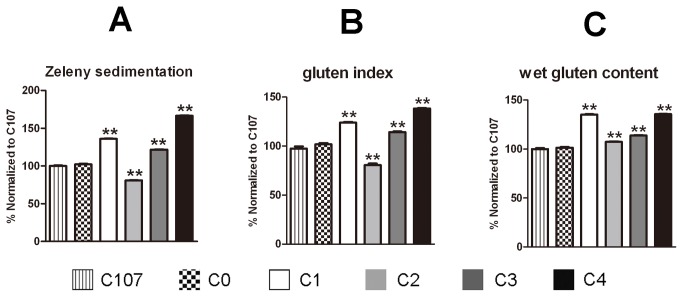
Figure 5. Comparison of other parameters associated with dough quality for the introgression lines and their parents.
Due to the high similarity of parameter results associated with dough quality between lines with the same HMW-GS composition, ILs were subgrouped into four categories, C1 (lines C1a and C1b), C2 (lines C2a and C2b), C3 (lines C3a and C3b) and C4 (lines C4a and C4b), according to the HMW-GS composition of each line. A comparison is made of each parameter among these four subgroups, 1Ax1-null IL C0 and the recurrent parent cultivar C107.
All results are expressed normalized to 100% of the results of parental line C107 for each parameter. Complete results are given in Table S1.
Data are given as mean ± SEM. *and ** indicates the significant differences within the same mixing parameter at 0.05 or 0.01 probability level, respectively.
A. Comparison of Zeleny sedimentation value; B. Comparison of gluten index; C. Comparison of wet gluten content.

