
Figure 1. Percentage of SW480 cells 30 min-2h post-synchronization from fixed cells presenting abnormal chromosome morphologies on glass, E50 and E20, determined on 2 pooled independent experiments.
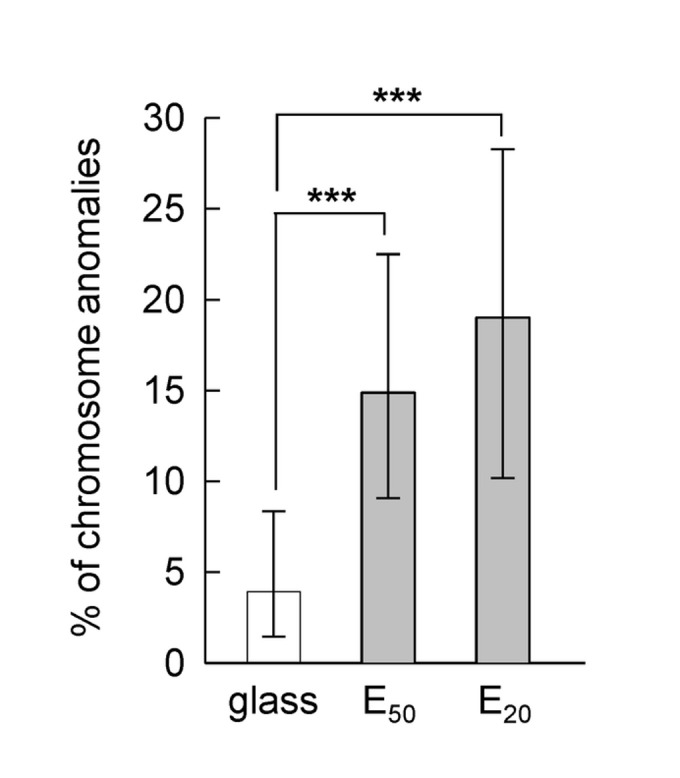
Fisher Exact Test shows the proportion on E50 (18 cells with chromosome anomalies on 121 cells analyzed) is significantly different than that on glass (6/153, p < 0.003), and the proportion on E20 (14/78) is significantly different than that on glass (p < 0.001). The errors bars represent 95% confidence intervals.