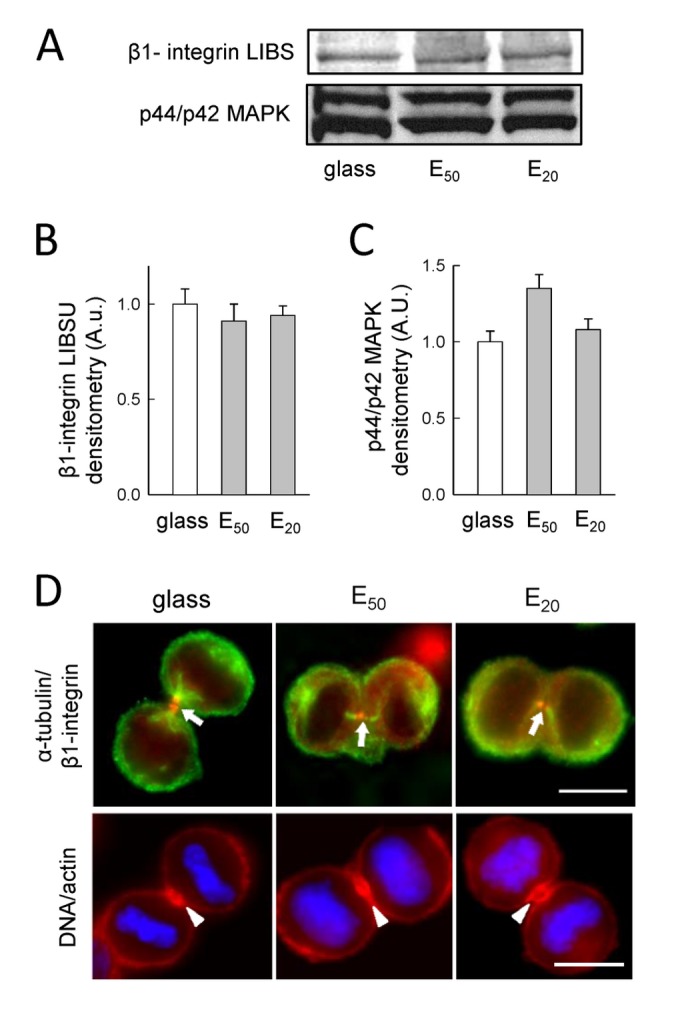
Figure 5. β1-integrin engagement of mitotic SW480 cells with respect to soft substrates.

A) Western blots of β1-integrin LIBS and MAPK protein for SW480 cells seeded 30 min post-synchronization on glass, E50 and E20. Histogram shows the corresponding scans from B) β1-integrin LIBS and C) p44/p42 MAPK control loading. Representive results from 2 independent experiments (the error bars represent the s.e.m.; an arbitrary value of 1 was attributed to the mean value corresponding to cells on glass). D) α-tubulin and β1-integrin distribution 30 min post-synchronization on glass, E50 and E20 from fixed SW480 cells, superposition of cells with anti-α-tubulin (green) and anti-β1-integrin (red) (α-tubulin/ β1-integrin). Arrow indicates a fine point of β1-integrin concentrated on the mid-body. Representative images are shown for 2 independent experiments for a total of 10 cells for each condition; scale bar : 10 µm. On glass, E50 and E20 from fixed SW480 cells, superposition of cells with DNA (blue) and actin (red) (DNA/actin). Arrowhead indicates actin accumulation in the cell mid-zone. Representative images are shown for 2 independent experiments for a total of 10 cells for each condition; scale bar: 10 µm.
