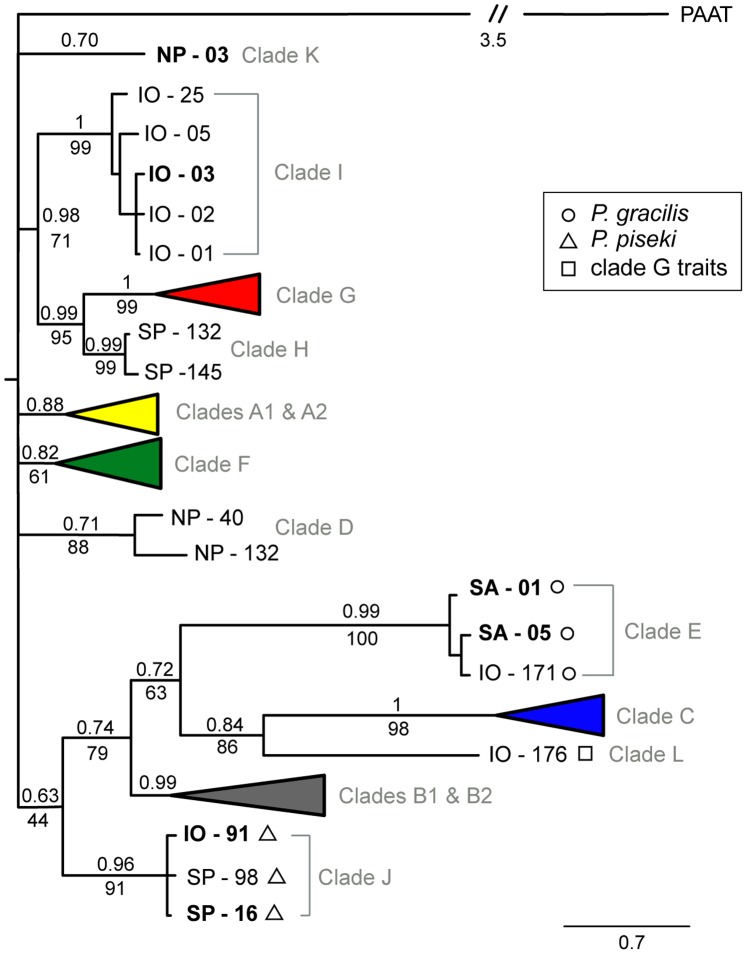
Figure 2. Bayesian phylogeny of 259 unique mtCOII haplotypes in the P. piseki- P. gracilis species complex (610-bp).
For clarity, five major clades are condensed into colored triangles on the tree (color as in Fig. 1). These 5 clades are shown in detail in figures 3 & 4. Bayesian posterior probability values are given above the branches, and bootstrap values from maximum likelihood (ML) analyses are given below the branches, when that node was supported in both Bayesian and ML analyses. Bold text indicates haplotypes that were sampled more than once. The tree is rooted, with Pareucalanus attenuatus defined as the outgroup (labeled PAAT; Calanoida, Eucalanidae). The scale bar is in units of substitutions per site (0.7). Shape symbols beside the haplotype identifiers indicate morphological traits of one or more specimens of that haplotype: triangle = P. piseki – like characters, circle = P. gracilis – like characters, square = ‘clade G – like’ characters (see Results for more detail). Morphological trait observations for major clades A, B, C, F, G are shown in figures 3 & 4.

