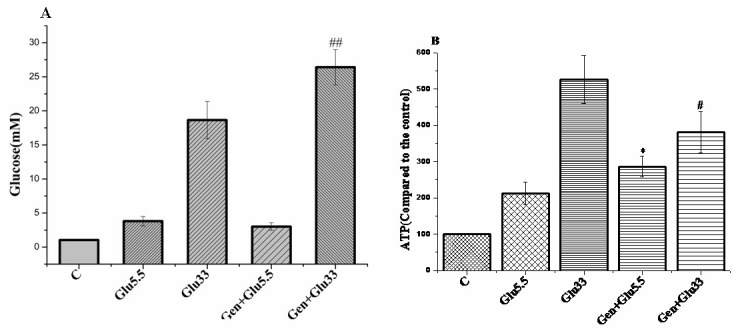
Figure 2. Effect of geniposide on glucose uptake and ATP production in INS-1 cells.

INS-1 cells were seeded onto 6-well plate. After overnight incubation, the cells were washed two times with KRBH buffer and starved for 2 hours in KRBH buffer. Then, different concentrations of glucose were added in the buffer and incubated for 20 minutes in the presence or absence of 10 μM geniposide. Glucose concentration in the buffer was measured and the uptake of glucose was determined by the difference of glucose concentrations in the buffer after incubation relative to pre-incubation. The intracellular content of ATP was measure in cell lysates using ATP bioluminescence assay kits according to the manufacturer’s instructions. Data are means ± SD from three representative experiments (n = 3, two wells for each replicate). * P <0.05 vs 5.5 mM glucose treatment; # P<0.05, ## P < 0.01 vs 33 mM glucose treatment.
