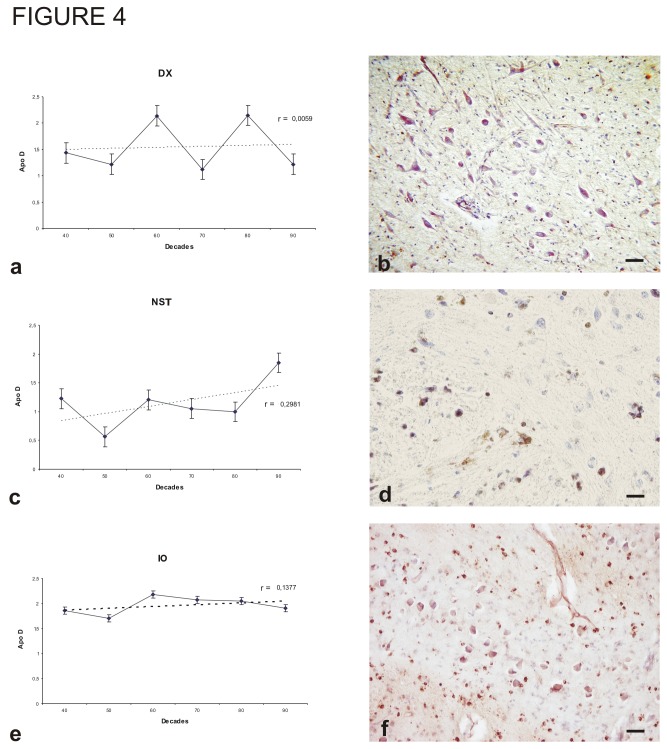
Figure 4. Immunohistochemistry for Apo D and amount of Apo D protein in some nuclei along different decades.
A, B) Dorsal motor nucleus of the vagus (DX). C,D) Nucleus of solitary tractis (NST). E, F) Inferior olivary nucleus (IO). Data presented as means of relative optical density (ROD). Each point in the graph represents mean density in a x20 field ±standar error of the mean. Regresion lines and Pearson`s correlation coefficient (r) are also shown. Bar: 40 μm.

