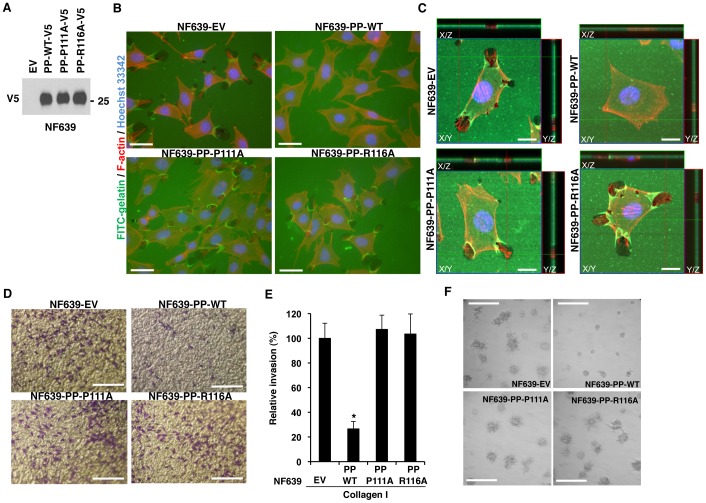
Figure 7. LOX-PP mutants unable to interact with CIN85 are unable to inhibit breast cancer cell invasion. Stable transductants of NF639-EV, and NF639-LOX-PP (PP) -WT, -P111A and -R116A cells were prepared.
(A) These were analyzed by WB for LOX-PP expression using the V5 tag. (B,C) Cells were subjected to a collagen degradation assay using coverslips coated with FITC-conjugated gelatin (green). F-actin and nuclei were labeled with TRITC-phalloidin (red) and Hoechst 33342 (blue), respectively and cells photographed at 50x magnification. Bars: 20 µm (B). Alternatively, confocal images of the slides are shown. Lines indicate region of XY image projected to generate orthogonal planes XZ and YZ. Bars: 10 µm (C). (D,E) The indicated NF639 cells were subjected to invasion assays, in triplicate, and photographed (Bar: 0.25 mm) (D). The numbers of cells invaded per field were determined (E).The average data from three independent experiments ± SD is presented relative to the EV control (set at 100%). P values were calculated using Student's t-test. *, P < 0.01 (E). (F) Stable transductants of NF639 cells were subjected to a Matrigel outgrowth assay. After 5 days, slides were photographed at 40x magnification. Bars: 0.25 mm.

