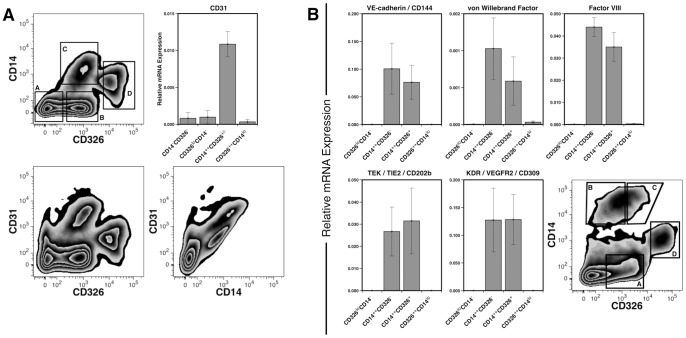
Figure 1. Gene expression by fetal LSECs. CD31 expression on CD14++ cells measured by flow cytometry and mRNA levels.
(A). Viable non-hematopoietic cells (PI−CD45−) gated by CD326 and CD14 expression (a: CD14−CD326−; b: CD326loCD14−; c: CD14++CD326+/−; d: CD326++CD14lo). Expression of CD31 was analyzed by qPCR in each sorted population (n = 3). Flow cytometric plots shows expression of CD31 versus CD326 and CD31 versus CD14. (B): Gene expression profile of sorted populations (a: CD326loCD14−; b: CD14++CD326−; c: CD14++CD326+; d: CD326++CD14lo) measured by qPCR, n = 7.

