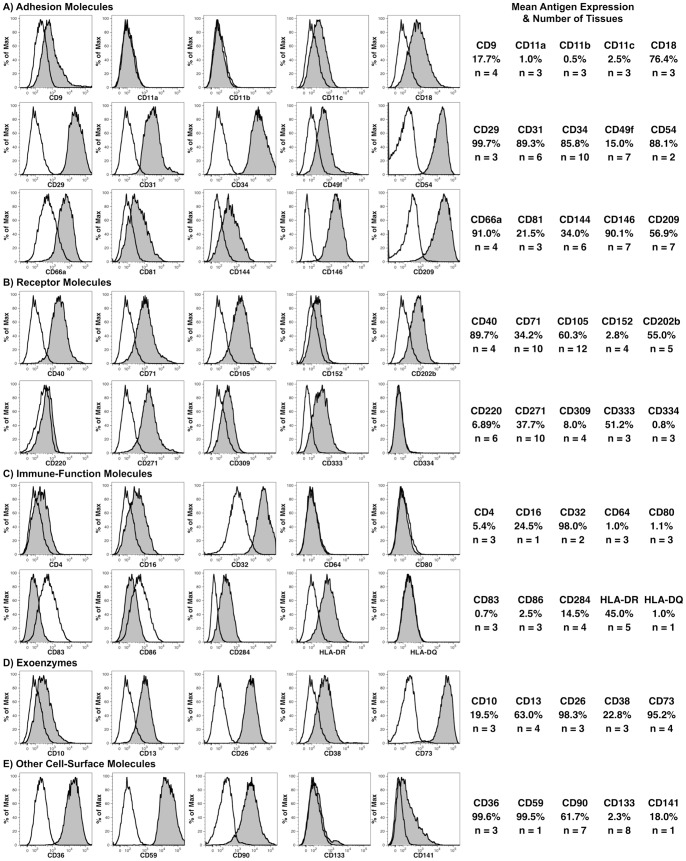
Figure 3. Flow cytometric analysis of antigens on LSECs.
LSECs were defined as CD14++CD45− cells using a CD45− gate as shown in Fig 4A and a CD14++ gate as indicated by region c in Fig. 1A. Expression of the indicated antigens is shown using filled histograms, whereas staining with the corresponding isotype-control antibody is shown using an unfilled histogram. The mean frequency of positive events and the number (n) of specimens analyzed are shown on the right.

