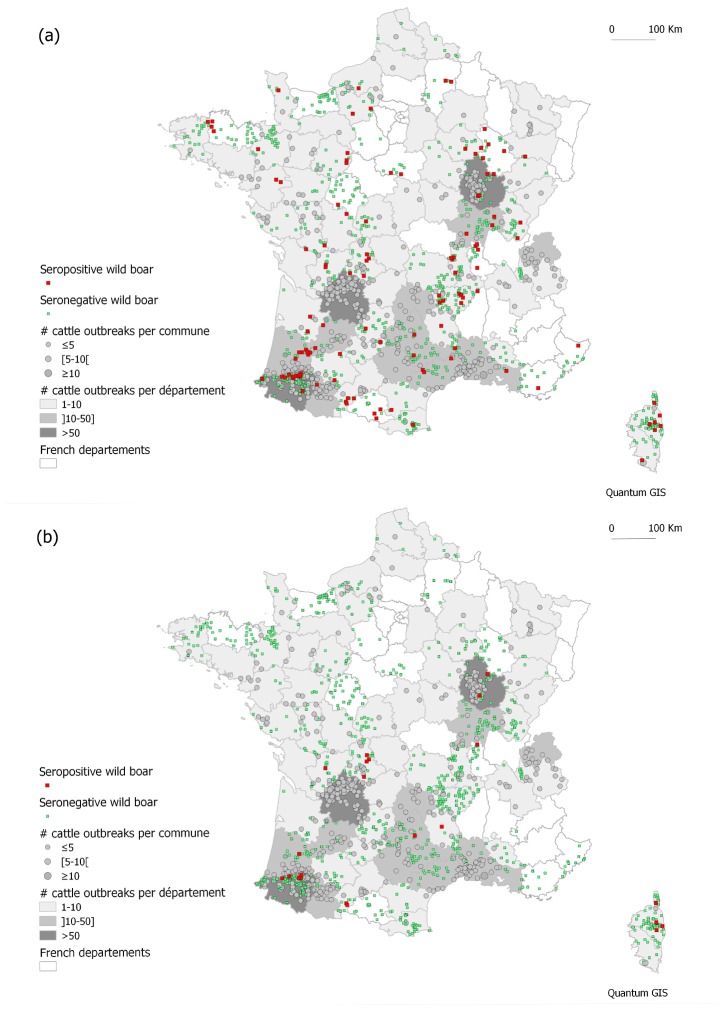
Figure 1. Distribution of the tested wild boar: green square= seronegative wild boar; red square = seropositive wild boar (a) when using the 0.2 cut-off and (b) when using the 0.5 cut-off.
Wild boar location was affected to the centroid of sampling commune. Circles figure the cumulative number per commune of TB outbreaks in cattle between 2000 and 2010 (diameter proportional to the number of outbreaks during the period, from 1 to 13) and the colour in the “département” the cumulative intensity of TB outbreaks detected in cattle in the same period (white “département”: no outbreak between 2000 and 2010; intensity of grey proportional to the number of outbreaks, from 1 to 141).

