
Figure 3. Distribution of average d-outbreak (in kilometers) obtained by bootstarp analysis for seropositve wild boar (a) using the 0.2 cut-off, and (b) using the 0.5 cut-off.
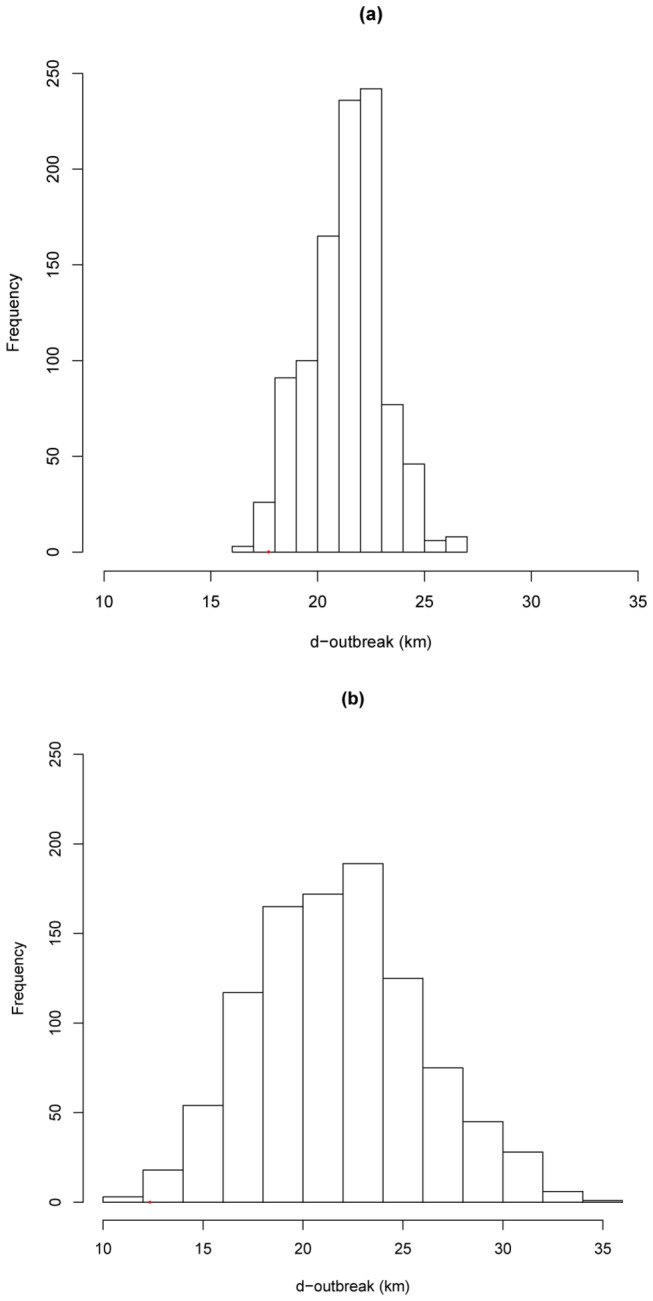
Histogram shows the distribution of simulated average d-outbreak under the null hypothesis (no relationship between seropositivity and d-outbreak). Bootstrap test was for 1000 repetitions. Red dot is the observed average d-outbreak.