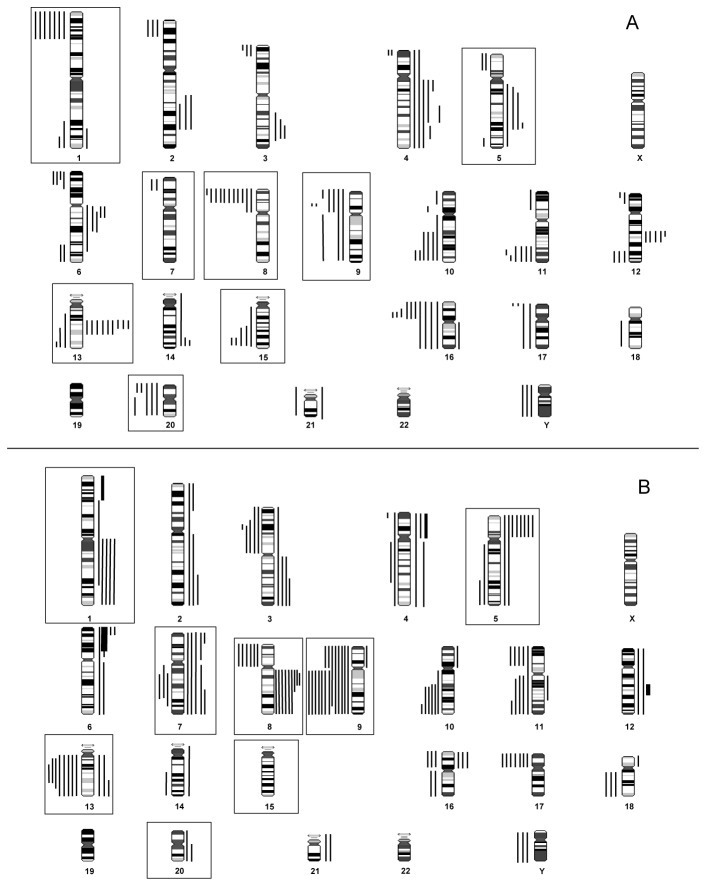
Figure 1. Superkaryogram of 29 CDC (A) and 26 UUT-UC (B) tumors.
Losses of DNA are shown as lines on the left sides of chromosome ideograms, gains on the right side. High-level amplifications (amplicons) are shown as thick bars at the corresponding chromosome regions. Significant differences are highlighted by orange boxes.

