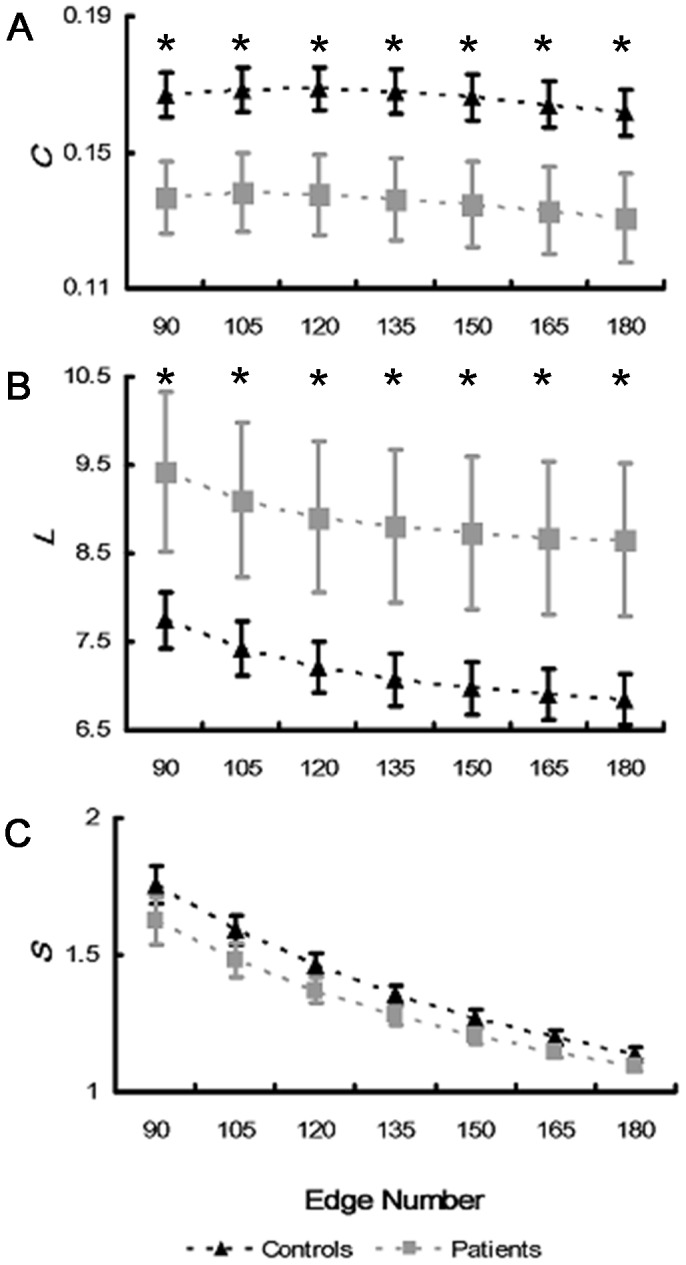
Figure 3. Global network parameters with respect to different thresholds.

Global clustering coefficients (A), characteristic path lengths (B) and small-worldness indexes (C) of brain networks during whole MRT (0–1200 ms) with respect to different thresholds were illustrated, respectively. Symbols *indicate the cases of significance difference after multiple comparisons correction by FDR (i.e., with p-values less than the significance threshold estimated by FDR, q<0.05).
