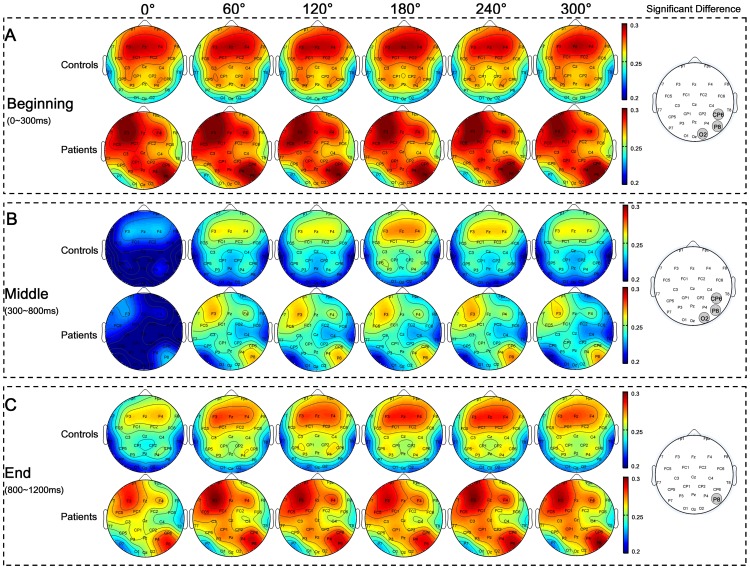
Figure 5. Nodal clustering coefficients in three sub-stages.
Nodal clustering coefficients of two groups with respect to angle in Beginning (A), Middle (B), and End sub-stages (C) were illustrated respectively. Gray wafers indicated the channels where stroke patients have larger clustering coefficient than control subjects by t-test (p<0.05). However, the t-test p-values of these channels are greater than the significance threshold estimated by FDR (q<0.05) for multiple comparisons correction.

