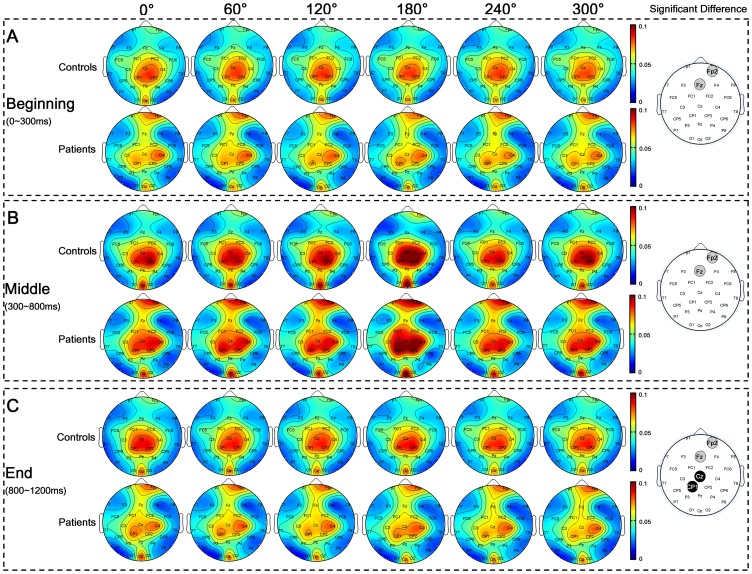
Figure 6. Nodal betweenness in three sub-stages.
Nodal betweenness of two groups with respect to angle in Beginning (A), Middle (B), and End sub-stages (C) were illustrated respectively. Gray wafers indicated the channels where stroke patients have larger betweenness than control subjects, while black wafers indicated the channels where patients have lower betweenness than control subjects by t-test (p<0.05). However, the t-test p-values of these channels are larger than the significance threshold estimated by FDR (q<0.05) for multiple comparisons correction.

