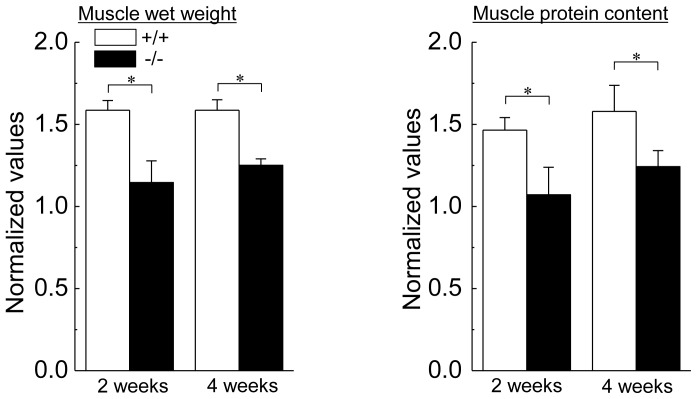
Figure 2. The rates of increase in the relative muscle weight and protein content to body weight.
Each bar represents the relative value of overloaded muscle vs. the contralateral control muscle, which is 1.0. See figure 1 for other abbreviations. Values are means ± SEM. n = 6 /group at each time point. *: significant difference at p<0.05.

