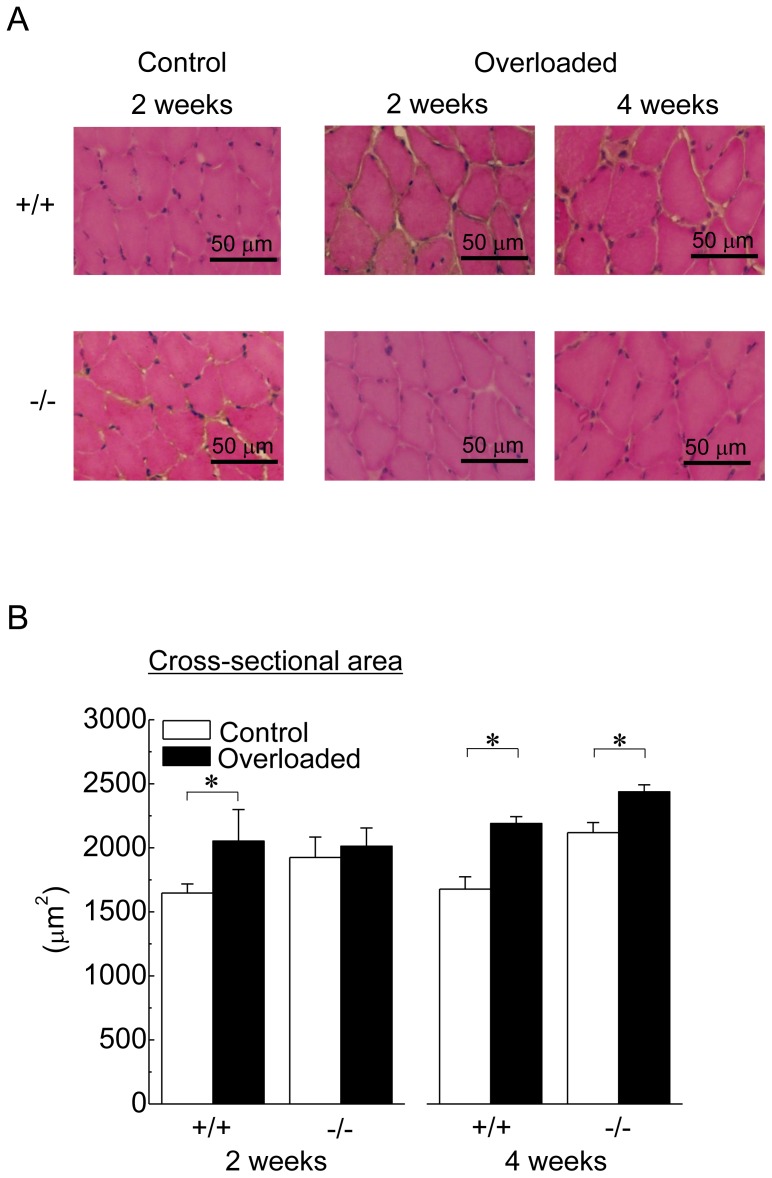
Figure 3. A: Transverse cryosections of the midbelly region of mouse soleus muscle stained with haematoxylin and eosin (H&E).
B: Responses of the mean fiber cross-sectional area. See figure 1 for other abbreviations. Values are means ± SEM. n = 6 /group at each time point. *: significant difference at p<0.05.

