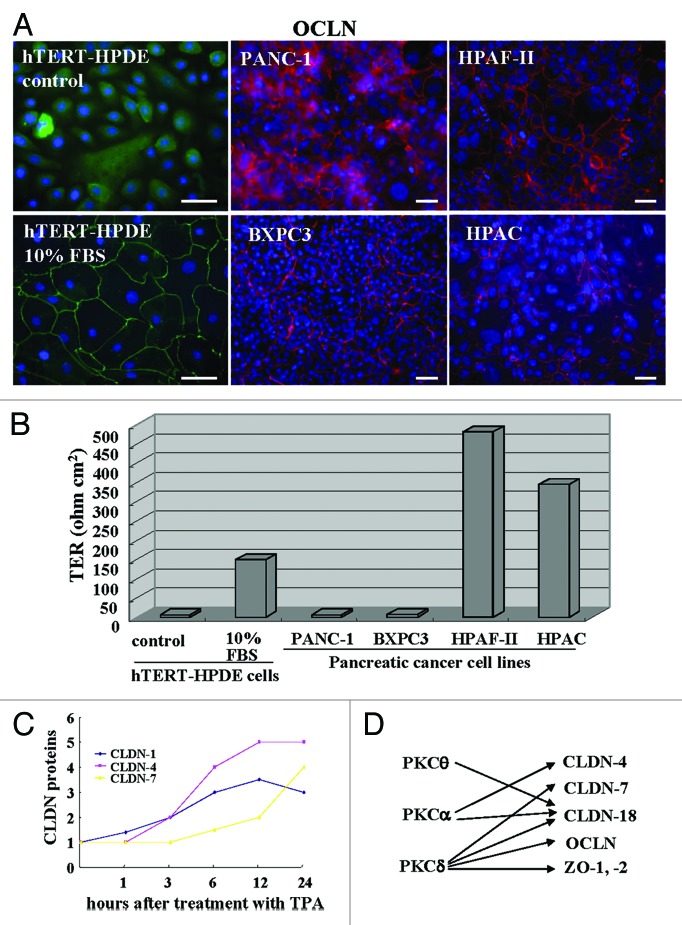
Figure 1.(A) Immunostaining for occludin and (B) TER values in hTERT-HPDE cells with or without 10% FBS and pancreatic cancer cell lines PANC-1, BXPC-3, HPAF-II and HPAC. Bars: 40 μm. Data represent the mean (n = 6). (C) A line graph for the changes in proteins of claudin-1, -4 and -7 in hTERT-HPDE cells treated with 100 nM TPA. (D) Diagram showing regulation of tight junction molecules via PKC isoforms in hTERT-HPDE cells. CLDN: claudin, OCLN: occludin.

An official website of the United States government
Here's how you know
Official websites use .gov
A
.gov website belongs to an official
government organization in the United States.
Secure .gov websites use HTTPS
A lock (
) or https:// means you've safely
connected to the .gov website. Share sensitive
information only on official, secure websites.
