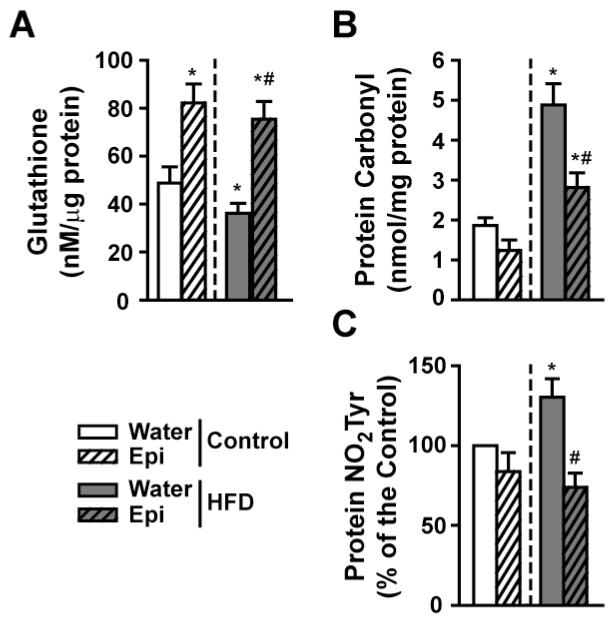
Figure 7. Modulation of SkM oxidative stress regulatory systems by Epi in 6 month old normal and HFD mice with Epi treatment.
(A) Changes observed in glutathione levels. (B) Changes observed in total protein carbonylation levels. (C) Differences observed in protein nitrotyrosine (NO2Tyr) residue formation. (n=6/group, *p<0.05 vs. water control, # vs. water-HFD).

