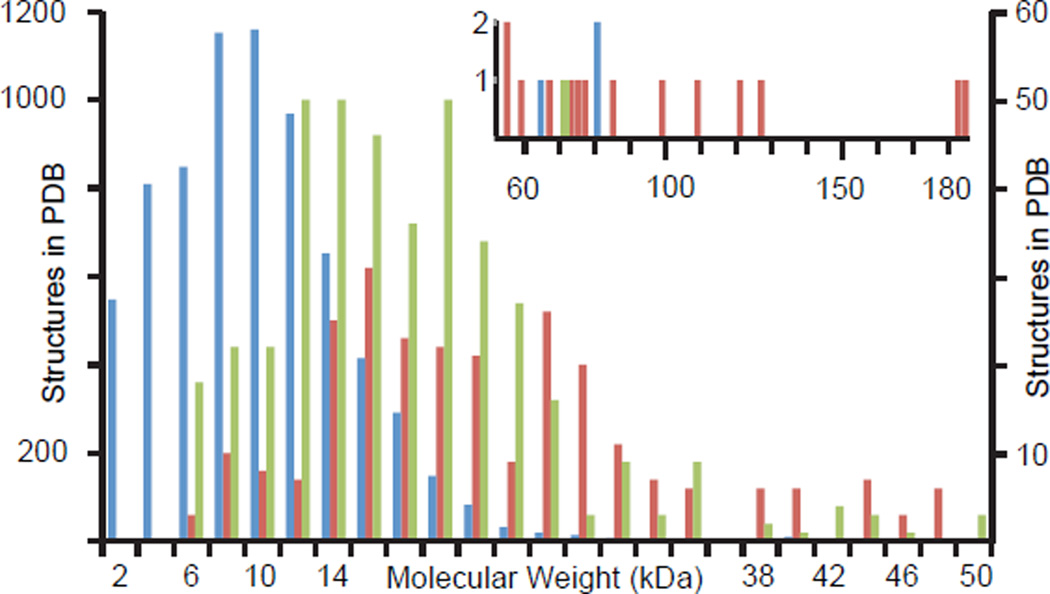
Figure 1.
Molecular-weight distribution of NMR structures in the PDB. Blue: Monomeric proteins, scaled to left axis. Green: homomeric proteins, right axis. Red: heteromeric proteins, right axis. The number of structures in all categories drops off dramatically at molecular weights above 20 kDa reflecting difficulties associated with solving these structures. The inset graph shows the number of structures greater than 50 kDa. These structures are predominantly heteromeric, reflecting a strategy in which structures of each subunit are solved individually and combined to model a complex.

