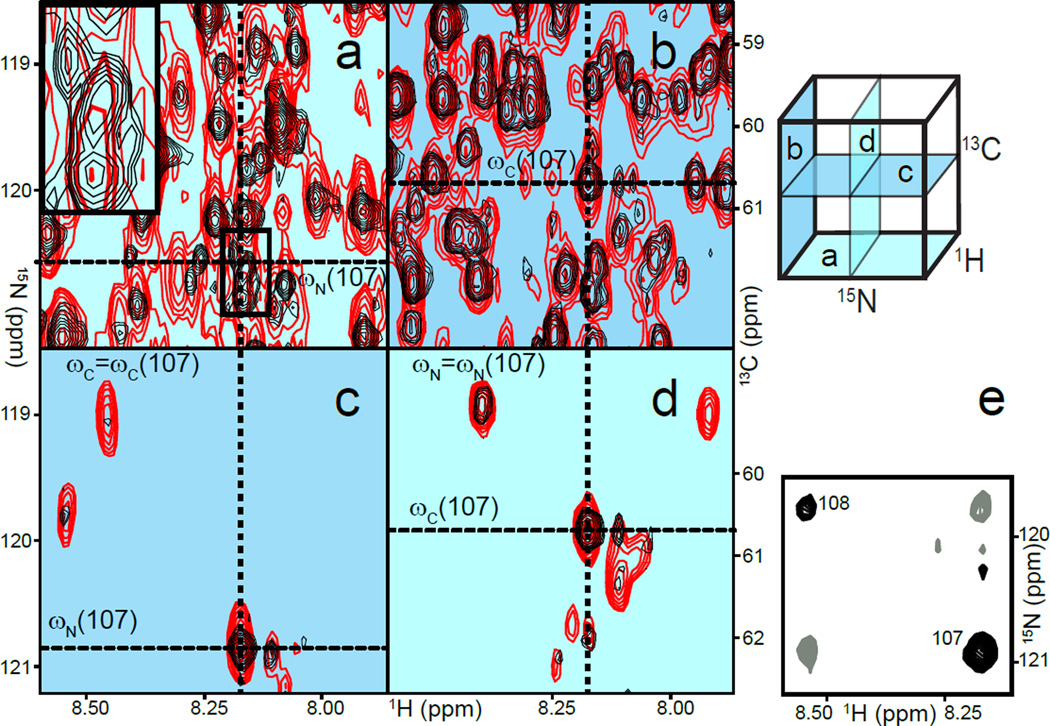
Figure 2.
Overcoming frequency degeneracies in a 53 kDa monomeric protein. Upper right: cartoon representation of a 3D HNCA; the labels refer to panels a,b,c, and d. a) H/N projection of HNCA with uniform (red) and non-uniform sampling (NUS, black). The inset emphasises a region in which four correlations appear as a single signal in the uniform experiment (thick line) but are resolved in the NUS experiment. The cross-hairs denote the frequencies of residue 107. b) H/C projection of the same spectrum. c) H/N plane at the frequency ωC=ωC(107), as defined in panel b. Signals only seen in the uniform data result from a leak-through of adjacent planes due to poor resolution in the carbon dimension. d) The corresponding H/C plane further emphasises the advantage of an increased resolution in nitrogen since fewer signals accidentally appear to share the same nitrogen frequency. e) The corresponding H/N plane of the (H)NCA(N)H experiment allows for straightforward identification of sequential residues 107 and 108.

