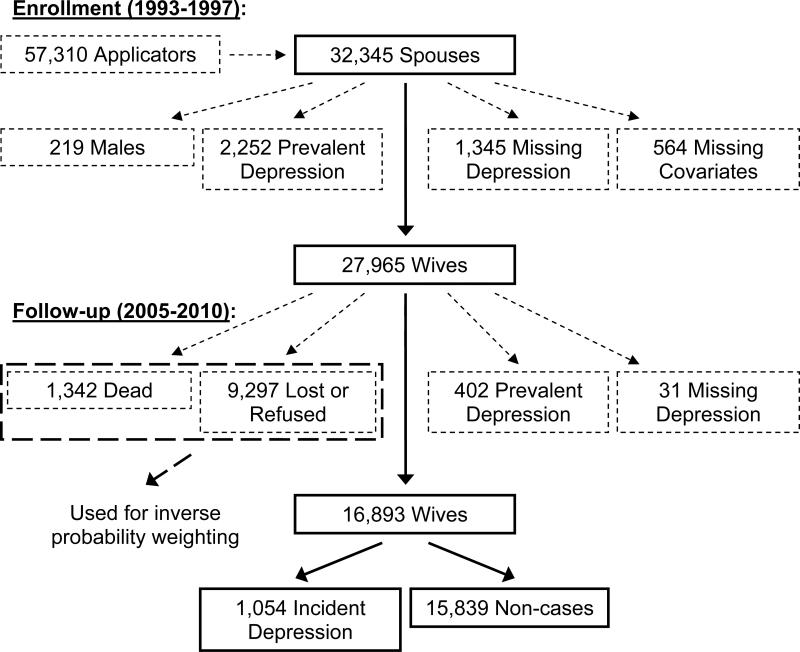
Figure 1.
Flow diagram depicting the study population for an analysis of pesticide use and self-reported, incident depression in wives from Iowa and North Carolina enrolled in the Agricultural Health Study. Boxes or lines marked with solid lines represent individuals who remained in the study after each step shown, whereas boxes or lines marked with small dashes represent individuals who were excluded after each step shown (see “2.1. Study population and case definition” for more details). Boxes or lines marked with large dashes represent individuals who, although not directly included in the analysis, were incorporated into the analysis via inverse probability weighting (see “2.3. Statistical analyses” for more details).

