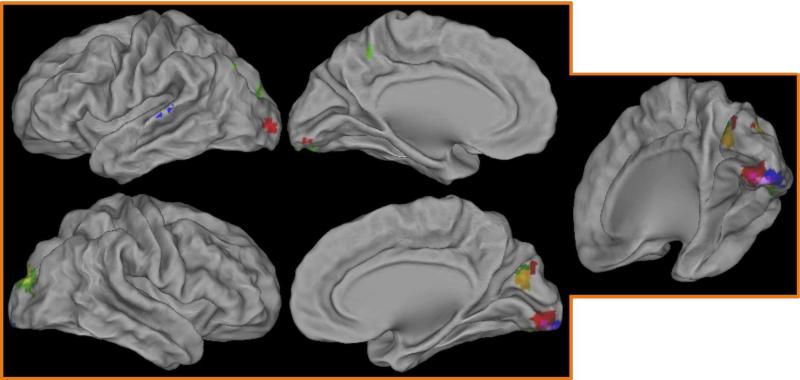
Figure 5. Brain regions showing interactions with pubertal status.
Colors indicate interaction type. Inset shows ventral posterior right hemisphere to highlight region of greatest overlap. Red: puberty × time; Green: puberty × sex × time; Blue: emotion × puberty × time; Yellow: overlap of puberty × sex × time and puberty × time; Purple: overlap of emotion × puberty × time and puberty × time; Pink: overlap between all three contrasts

