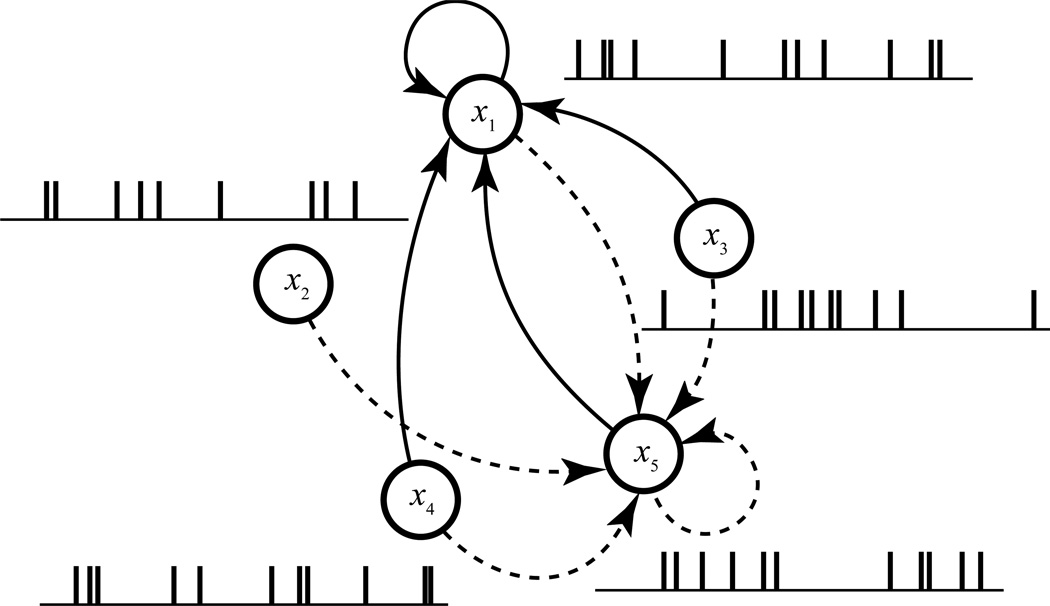
Figure 1.
Schematic diagram showing the functional connectivity within a neuron population. For a given neuron (#1), the functional connectivity is defined as the causal relations (solid arrowed lines) between the spike trains (x1, x2, x3, x4, and x5) of all neurons to the spike train of this neuron (x1). This procedure is repeated for other neurons (e.g., dashed arrowed lines for neuron #5) to derive the functional connectivity of the whole population.

