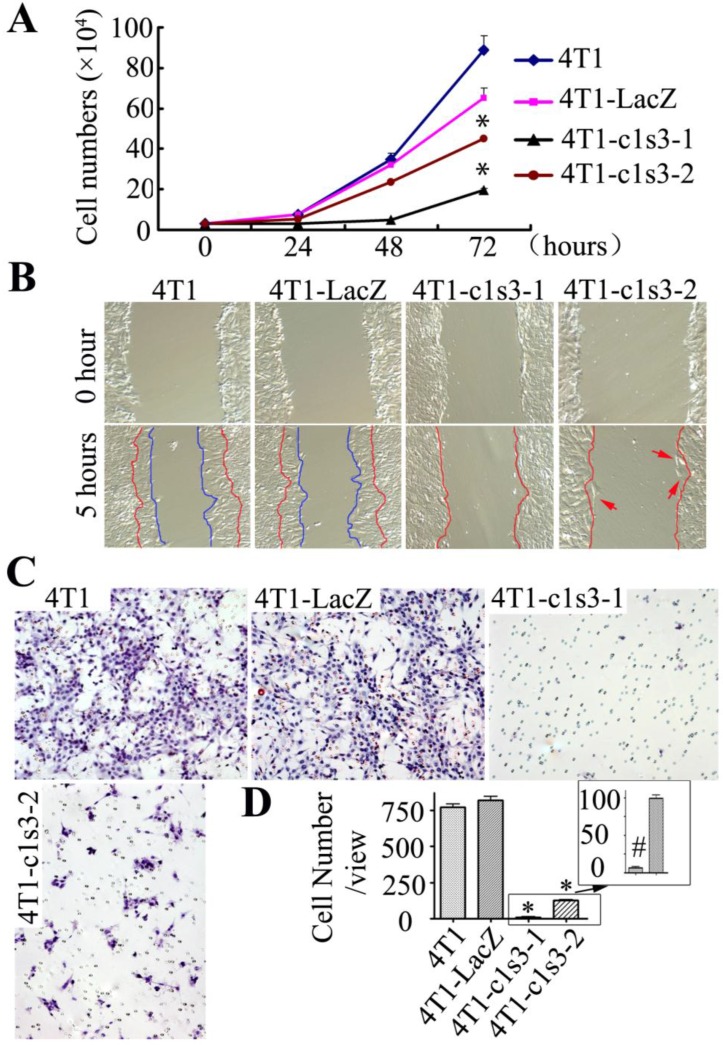
Fig 2.
Growth, migration, and invasion of Atp6v1c1-depleted 4T1 mammary tumor cells in vitro. A. Cell growth assay of different 4T1 cells as indicated. Results are mean ± s.e.m. (n=3). * P<0.05 compared with 4T1-LacZ by student's t-test at the endpoint. B. Migration assay of different 4T1 cells as indicated. The cells between the red curves and marked by red arrows are the migration cells (primary magnification ×100). C. Invasion assay of different 4T1 cells as indicated (primary magnification ×100). D. Quantification of invasion cells per view area. Results are mean ± s.e.m. (n=10). * P<0.05 compared with that of 4T1-LacZ cells. # P<0.05 compared with that of 4T1-c1s3-2 cells. The cells shown were representative of the data (n=3).

