Figure 4.

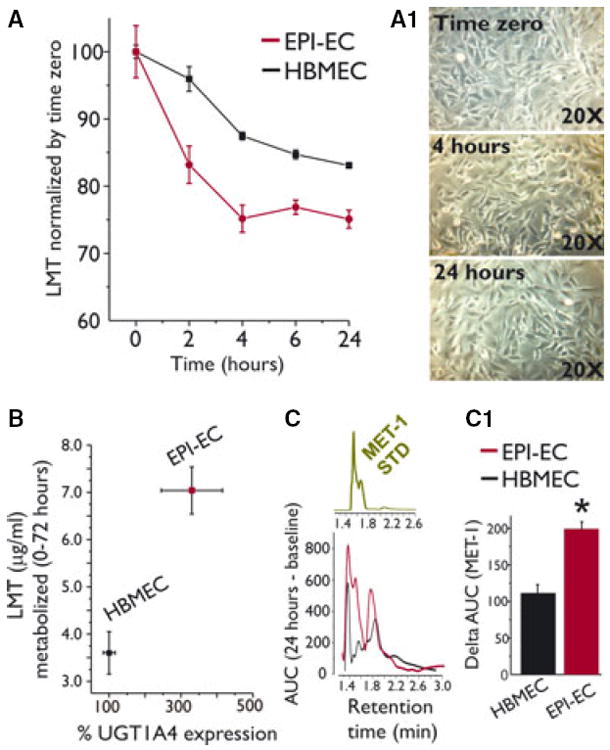
Endothelial expression of UGT1A4 and lamotrigine metabolism. (A) EPI-ECs and control HBMECs were incubated with lamotrigine (LMT). EPI-ECs metabolized LMT to a greater extent compared to HBMECs. Data are normalized by time zero. No significant changes were measured in the presence of media alone (not shown). (A1) LMT did not provoke significant cell toxicity. (B) UGT1A4 expression (as determined by western blot) is proportional to the amount (μg/ml) of LMT metabolized. (C–C1) The specific LMT metabolite, MET-1, was detected by HPLC-UV. MET-1 standard is shown in the insert. Note that MET-1 levels were significantly higher in EPI-ECs compared to HBMECs (data are expressed as area under the curve, AUC). Results are expressed as mean ± SEM. The asterisk indicates p < 0.05.
