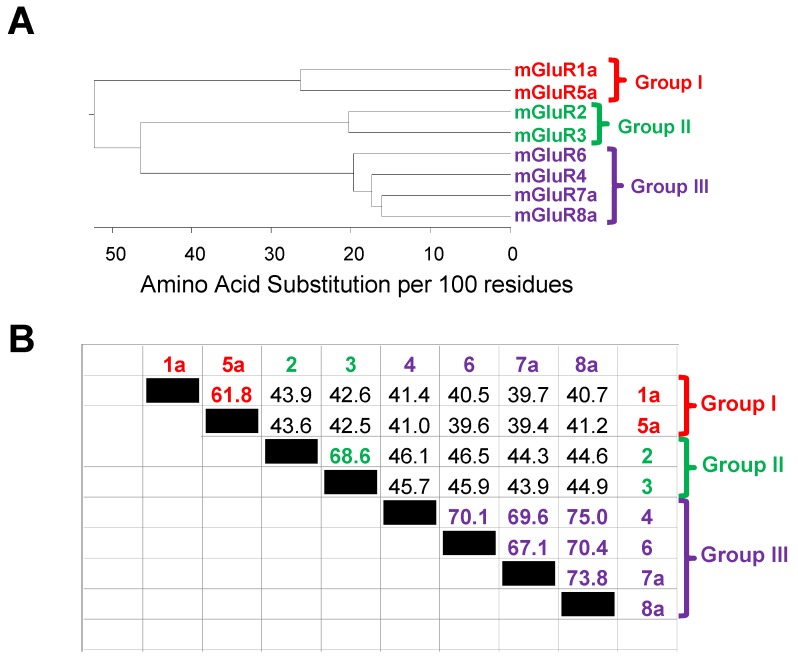
Fig 2.
The amino acid sequence homology among various metabotropic glutamate receptors. The phenogram in panel A illustrates the relationship between the three mGluR subgroups (Group I, II and III) and the individual receptors within each group. Branch length is indicative of amino acid identity between the protein sequences. The table in panel B illustrates the percent amino acid identity between all receptor pairwise combinations. Note that the highest similarity is observed between members of the same group (i.e. mGluR1 vs. mGluR5). The phenogram in panel A and the table in panel B were generated using the DNAStar software suite (DNASTAR, Inc., Madison, WI, USA) and amino acid sequences obtained from NCBI. Accession numbers: mGluR1a = NP_000829.2, mGluR2 = EAW65150.1, mGluR3 = NP_000831.2, mGluR4 = NP_000832.1, mGluR5a = NP_001137303.1, mGluR6 = AAB82068.1, mGluR7a = EAW63933.1, and mGluR8a = EAW83621.1.

