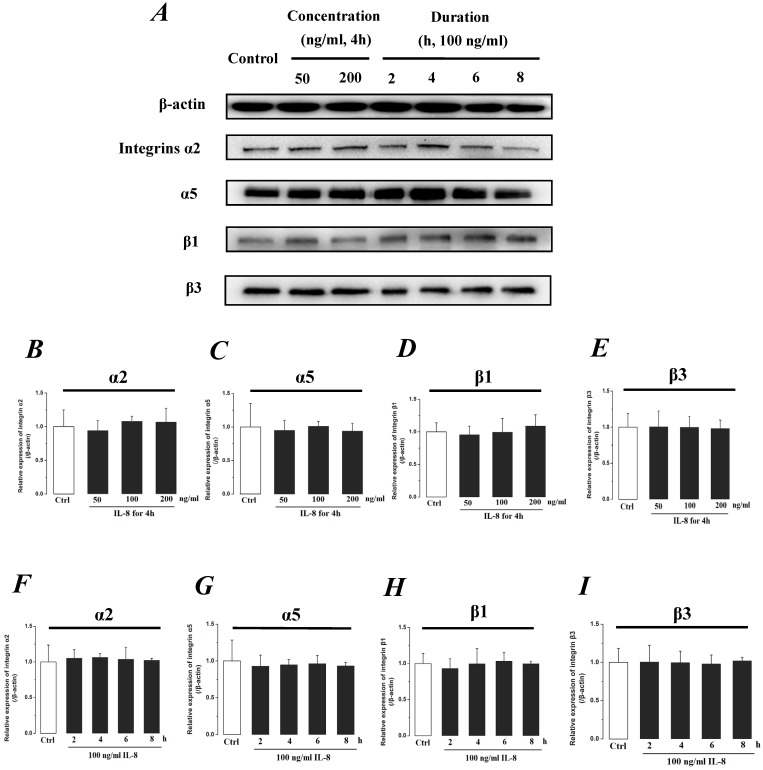
Fig 7.
The effect of IL-8 on the protein expression level of Integrin subunits, α2, α5, β1 and β3. There were not significant differences of expressions level of Integrin subunits treated by either concentration or duration of IL-8. (A) Representative Western blot bands of integrins expression. Quantification of each protein expression level by image analysis of the Western blot bands in fig A. The relative expression were calculated by expression level of β-actin in each group as intrinsic controls. (B-E) The expression level of Integrin subunits, α2, α5, β1, and β3 with different doses of IL-8 (50, 100 and 200 ng/ml) for 2h. (F-I) The expression level of Integrin subunits, α2, α5, β1, and β3 with 100 ng/ml IL-8 for 2, 4, 6 and 8h, respectively. Values represented the mean±S.D. (n=3). *, P<0.05 denoted statistically significant difference compared to control.

