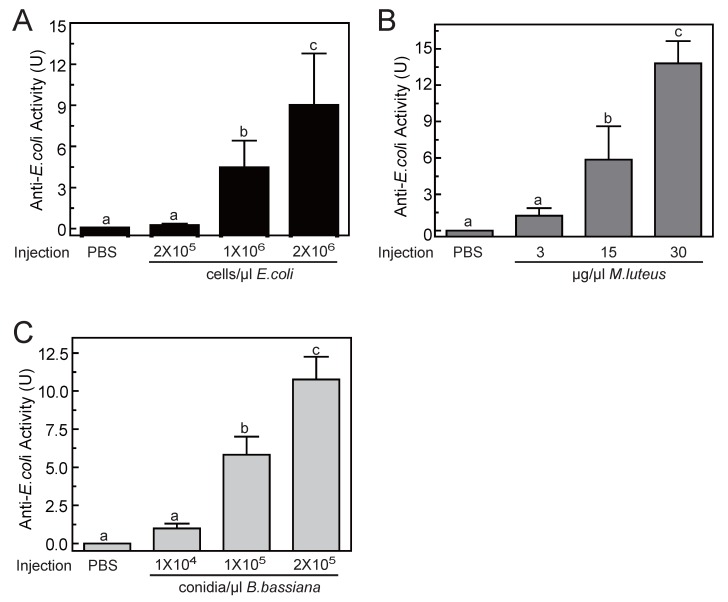
Figure 5.
Antimicrobial activity assay of O. furnacalis hemolymph after the inducement by E. coli (A), M. luteus (B), and B. bassiana (C). The bars represent mean ± S.D. (n = 3). Bars labeled with different letters (a, b, and c) are significantly different (one-way ANOVA, followed by the Newman-Keuls test, P <0.05).

