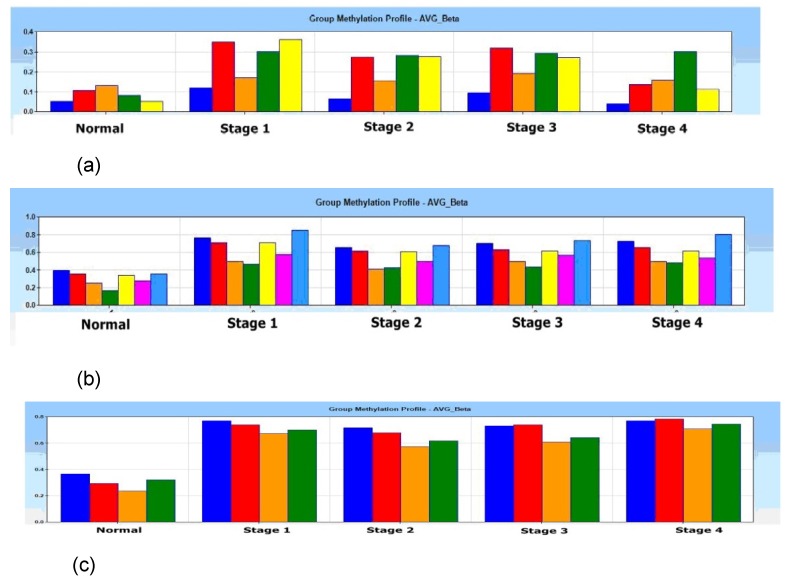
Fig 1.
Histogram of group methylation profiles of (a) p16 (b) DDAH2 and (c) DUSP1 alleles average β value between normal and 4 pathological stages (Stage 1, 2, 3 and 4). Distinct profile shows lower average β value in normal subjects if compared with pathological stage 1, 2, 3 and 4 for (a) p16 (b) DDAH2 and (c) DUSP1 alleles.

