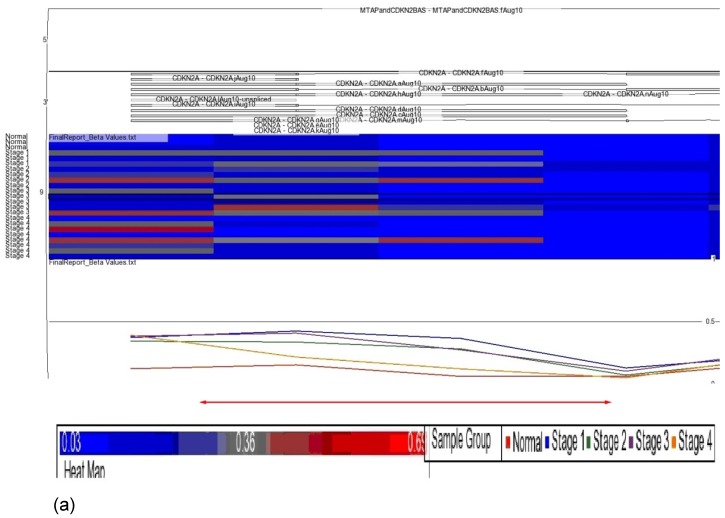
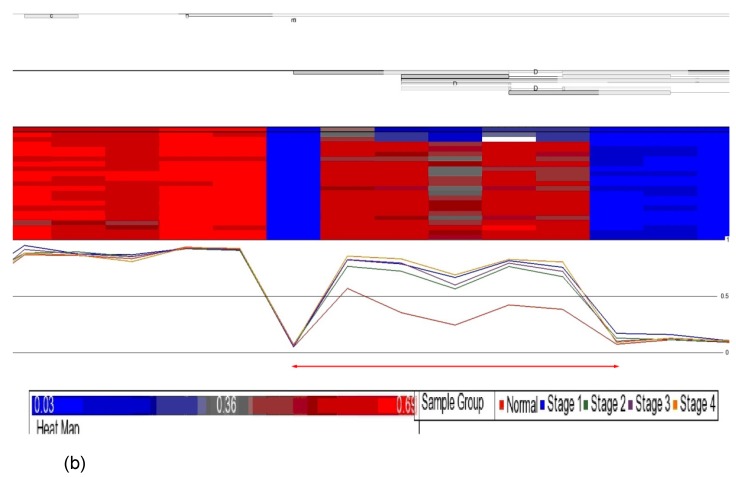
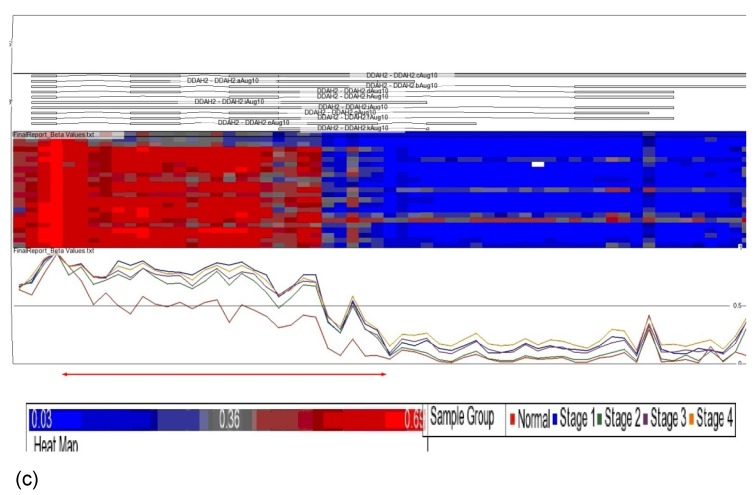
Fig 3.
Partek Genomic Suite Visualization. The upper panel of each shows the heat map for each probe of (a) p16, (b) DUSP1 and (c) DDAH2 genes in normal and four pathological stages. The line graphs in the lower panel of each show log2 ratio of β values of each probe between normal and four pathological stages with clear separation (indicated with red arrow).


