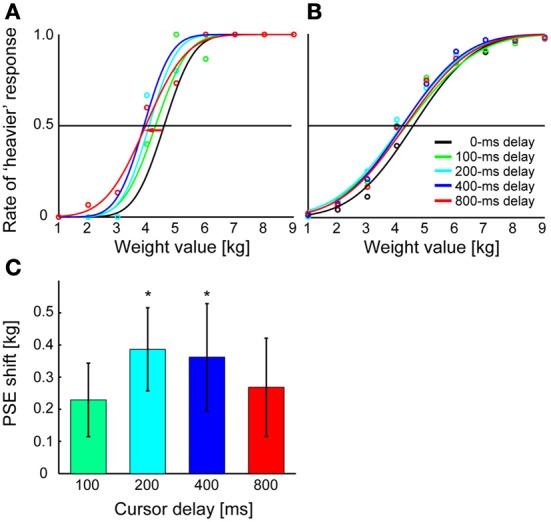
Figure 3.

Results of Experiment 1. (A) Results are shown for a typical participant. The mass value at which each curve crosses the 0.5 line is PSE for each delay value. The red arrow indicates the shift of PSE for a 800-ms delay from that for a 0-ms delay (see panel C). (B) Psychometric functions are fitted to data averaged across participants. Average judgment rate across participants was calculated for each mass value, and sigmoid functions were fitted to the averaged rates. (C) For each delay, the shift of PSE from that for a 0-ms delay is shown. Shifts were calculated for each cursor delay and averaged across participants. Error bars indicate standard error of measures across participants. *p < 0.05 according to Ryan's multiple (four) comparison tests for difference in PSE between 0-ms delay and the other delay conditions.
