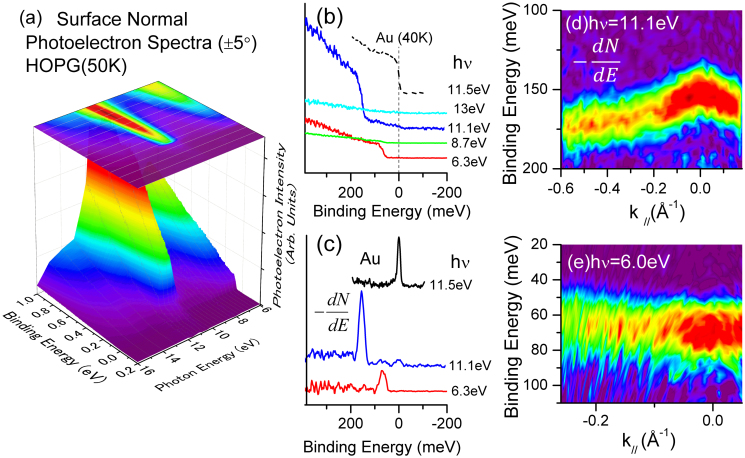
Figure 2. Photoelectron spectra of graphite.
(a) Surface-normal photoelectron spectra of HOPG at 50 K taken at 6 eV ≤ hν ≤ 16 eV. (b) Typical spectra of HOPG taken at several photon energies along with that of the Au film at 40 K. (c) Differentials of the photoelectron intensity with respect to the binding energy. (d,e) Differentials of the photoelectrons as a function of the parallel momentum of the electron.

