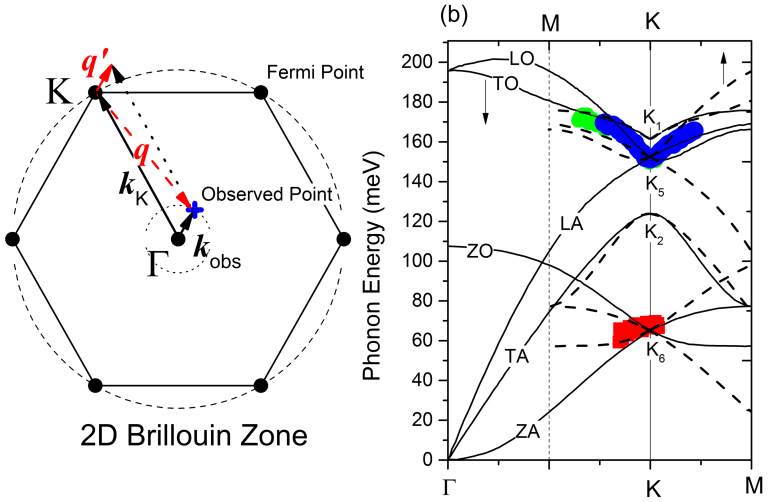
Figure 3. Description of phonon-dispersion measurement using ARPES.
(a) Schematic of electron-phonon scattering in the two-dimensional Brillouin zone. The electron at the K-point (kK) is scattered by the phonon (q) and then observed at kobs. Here, kobs = q′ = q + kK. (b) The pseudo-gap energy as a function of the parallel momentum of the electron (the green and blue dots represent the results of independent measurements at hν = 11.1 eV, and the red dots represent the results at hν = 6.0 eV). The solid and dotted lines represent the results of the phonon dispersion on the K-Γ and K-M lines, respectively. Irreducible representations of the phonon symmetry at the K-point are shown in the figure.

