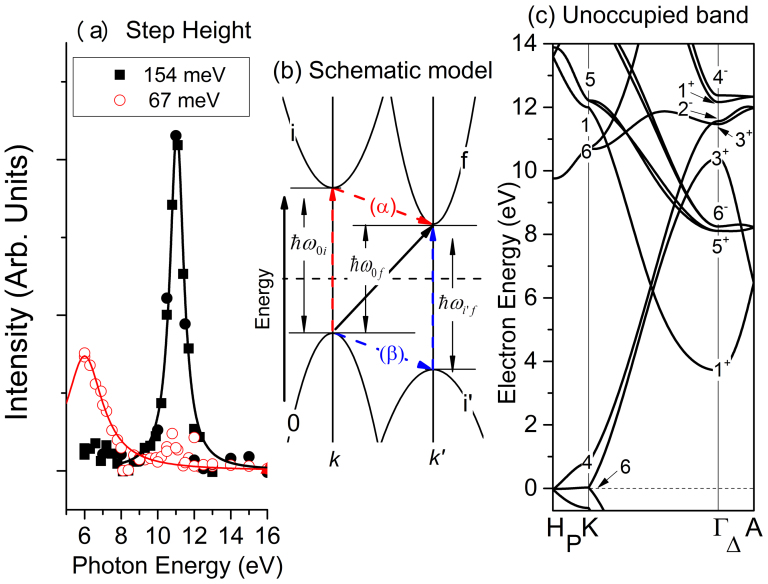
Figure 4. Description of the ‘direct' observation of the indirect transition.
(a) The step-height intensity of the two gaps as a function of the phonon energy (solid square: 154 meV; red open circles: 67 meV), together with the Lorentzian peaks (black solid line: 11.05 eV of the peak and 0.92 eV of the width; solid red line: 6.0 eV of the peak and 1.2 eV of the width). (b) Schematic model of the indirect transition. See equation (2) for details. (c) Band dispersion for the unoccupied state of graphite from the DFT-LDA calculations. Irreducible representations of the band symmetry at the K- and Γ-points are shown in the figure.

