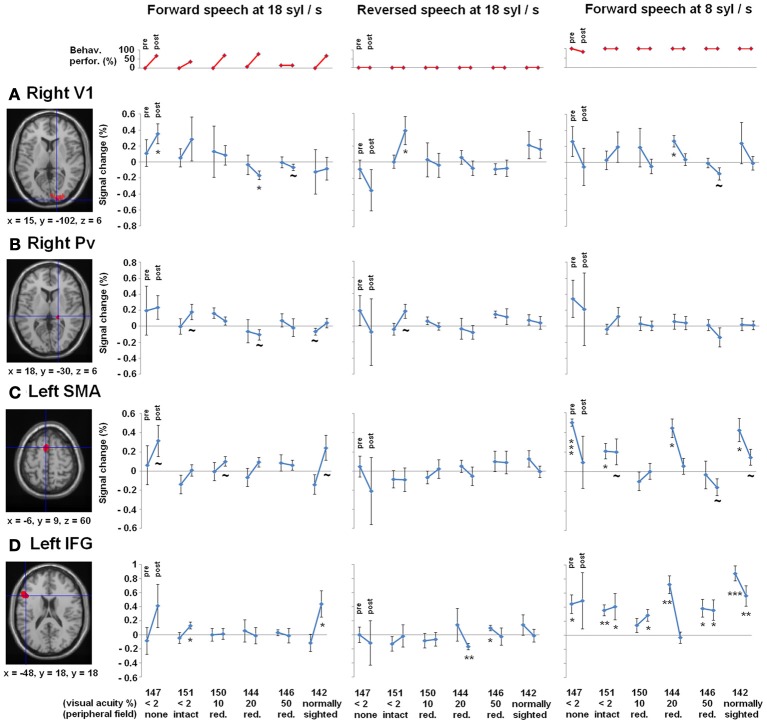
Figure 4.
Regions-of-interest (ROI) analyses, (A) right primary visual area (V1) and (B) right pulvinar (Pv), (C) left supplementary motor area (SMA) as well as the (D) left inferior frontal gyrus (IFG)—all clusters derived from Dietrich et al. (2013), overlaid on an anatomical T1 template. Upper plot (red): Behavioral performance of understanding ultra-fast speech (18 syl/s) pre- and post-training. Participants are arranged according to their visual acuity. Lower plots (blue): Percent signal change during forward (left) and reversed (middle) ultra-fast speech (18 syl/s) as well as forward moderately fast (8 syl/s) speech (right) pre- and post-training (vs. baseline). Significant differences from zero (one sample T-tests): *p < 0.05, **p < 0.01, ***p < 0.001, ~ p < 0.1.

