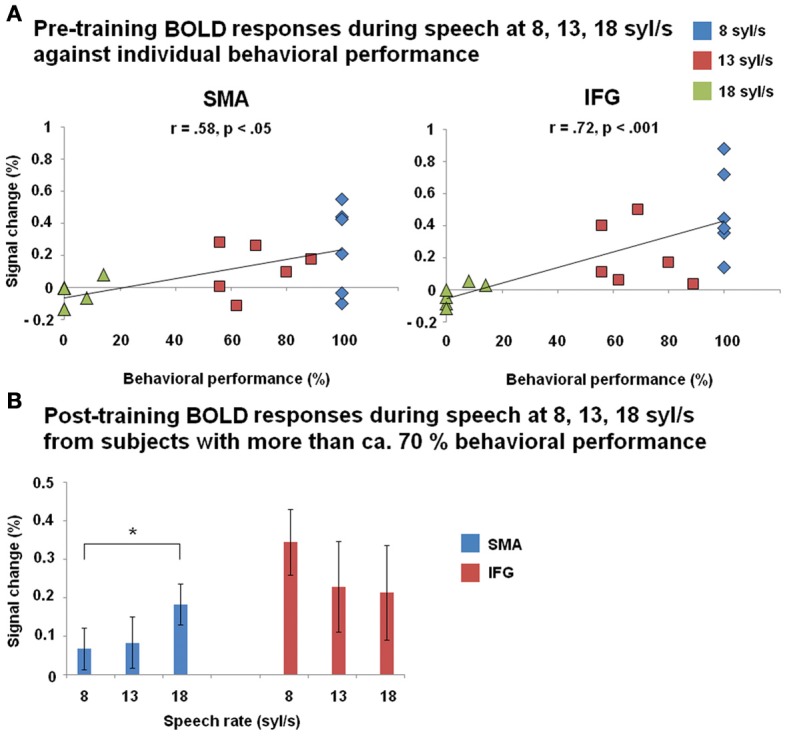
Figure 6.

(A) Correlation between BOLD responses during forward speech pre-training and individual behavioral performance within left SMA and inferior frontal gyrus (IFG) across all three speech rates (8, 13, 18 syl/s) and across all subjects. (B) BOLD responses during forward speech post-training for each speech rate (8, 13, 18 syl/s) within left SMA and IFG. Only subjects with a performance level of more than ca. 70% at speech rate (8 syl/s: n = 6; 13 syl/s: n = 6; 18 syl/s: n = 4) are included. Significant differences (paired T-test) emerged between moderately fast and ultra-fast speech within left SMA.
